
DEMOGRAPHY & CENSUS
Introduction
- A census is a comprehensive process that involves the collection, compilation, analysis, and dissemination of information about every individual in a country or a well-defined part of a country at a specific point in time. It is primarily focused on demographic, economic, and social data. This process is crucial for governments, policymakers, researchers, and various organizations as it provides a detailed snapshot of the population and its characteristics.
Census in India
- The census in India has a long and rich history that dates back to ancient times, evolving through the medieval period and the colonial era, leading up to the modern-day process that is well-structured and legally backed.:
| Period | Significant Milestones and Aspects |
| Ancient and Medieval Times | Rigveda (800-600 BC): Earliest evidence of population tracking.
Arthashastra (3rd Century BC): Kautilya’s text recommended population counts for taxation policies. Ain-i-Akbari (16th Century AD): Administrative report from Akbar’s reign with extensive population data. |
| Prior to Independence | First Census in England (1800): Beginning of modern census history.
Early Censuses in India: Conducted in Allahabad (1824) by James Princip And Banaras (1827-1828). First Non-Synchronous Census (1872): Under General Lord Mayo’s Administration. First Synchronous Census (1881): Conducted by W.C. Plowden, marking the start of regular decadal censuses under British rule. |
| Constitutional and Legal Support | Census Act of 1948: Governs the conduct of the census, ensuring confidentiality of personal information. Drafted under the guidance of Sardar Vallabhbhai Patel.
Article 246, Indian Constitution: Classifies the population census as a Union affair, listed under the seventh schedule at serial number 69. |
| Present Status | Registrar General and Census Commissioner: Under the Ministry of Home Affairs, responsible for conducting the census every ten years.
Census Organization Evolution: Initially formed on an ad-hoc basis for each Census until 1951, now a permanent establishment overseeing census operations. |
Significance of Census
- The census, as a comprehensive exercise to collect data on every individual in a country, holds immense significance for various stakeholders ranging from government authorities to researchers and businesses. The 2011 Census, being the fifteenth national census of India, underscores the critical role of the census in understanding and planning for the nation’s needs.
- Foundation for Decision Making
- Grassroots Data: The census provides primary data at the granular level of villages, towns, and wards, which is invaluable for local planning and development initiatives.
- Legislative Use: Data from the census is utilized for decision-making by various legislative bodies, including the Parliament, state assemblies, Panchayats, and local bodies. This information is crucial for allocating resources, planning infrastructure, and setting policies that reflect the demographic realities of different regions.
- Development Analysis
- Tracking Progress: The census offers a snapshot of the nation’s development over the previous decade, allowing for an analysis of growth, changes in population dynamics, and the effectiveness of government policies.
- Government Initiatives: It keeps track of the progress of current government initiatives, providing a factual basis to evaluate their impact and effectiveness across different segments of the population.
- Planning and Policy Formulation
- Future Planning: Perhaps the most significant aspect of the census is its role in making future plans. By understanding the demographic trends and changes, policymakers can anticipate future needs and challenges, planning accordingly.
- Policy Formulation: The detailed demographic information aids in formulating policies tailored to the specific needs of different population groups, ensuring that policies are inclusive and effective.
- Diverse Applications
- Academic Research: Researchers and academicians use census data to study demographic trends, social changes, and their implications on society. This research can inform policy and contribute to scholarly discourse on population studies.
- Business and Industry: Businesspeople and industrialists utilize census data to understand market demographics, plan investments, and tailor products and services to meet the needs of different population segments.
- National and International Agencies: The census data is also crucial for national and international agencies planning development programs, aid distribution, and other initiatives aimed at improving living standards and economic development.
The census is a pivotal tool that impacts nearly every aspect of national planning and development. It provides a detailed and accurate picture of the country’s demographic landscape, which is essential for effective governance, economic planning, social welfare programs, and much more. The comprehensive nature of the census data makes it an indispensable resource for informed decision-making and strategic planning across various sectors.
SOCIO-ECONOMIC CASTE CENSUS (SECC)
The Socio-Economic Caste Census (SECC) conducted in 2011 is a comprehensive exercise that aimed to collect detailed information on the socio-economic status and caste details of Indian households. This was a significant effort, marking the first time since 1931 that such detailed data was collected.
- Objectives of SECC
- Economic Assessment: The primary aim was to evaluate the economic standing of every household in India, both in rural and urban areas. This was intended to help Central and State authorities develop deprivation indicators to identify poor or deprived individuals for targeted welfare programs.
- Caste Data Collection: Another objective was to gather detailed information on caste, enabling the government to reassess the economic conditions of various caste groupings. This could inform policies related to caste-based affirmative action and welfare schemes.
- Differentiating SECC from the Regular Census
- Field of Coverage:
SECC: Focused on identifying households that require state assistance and gathering detailed socio-economic and caste data.
Census: Provides a comprehensive picture of the entire population, covering various demographic aspects without delving into socio-economic statuses or caste details.
- Data Secrecy and Usage:
- SECC: The data collected can be utilized by government entities to allocate or limit benefits, making it a tool for targeted welfare interventions.
- Census: Data is considered confidential and is used for broader planning and policy-making without targeting specific households for benefits.
- Conducting Authorities:
The SECC 2011 involved three separate components, each managed by different authorities but coordinated by the Department of Rural Development:
-
- Rural Areas Census by the Department of Rural Development (DoRD).
- Urban Areas Census by the Ministry of Housing and Urban Poverty Alleviation (MoHUPA).
- Caste Census by the Registrar General of India (RGI) and Census Commissioner, under the Ministry of Home Affairs.
- Significance of SECC
- Constitutional Mandate: Article 340 of the Indian Constitution mandates the establishment of a commission to investigate the conditions of socially and educationally disadvantaged groups, recommending measures for their improvement. The SECC helps fulfill this mandate by providing the necessary data.
- Mapping Inequalities: The SECC enables a more detailed mapping of socio-economic disparities, crucial for formulating targeted interventions and policies.
- Affirmative Action and Welfare Programs: The caste data collected can provide statistical support for the continuation or adjustment of caste-based affirmative action and welfare programs.
- Legal Necessity: For any changes or continuations in reservation policies, “quantifiable data” is required by the courts. The SECC provides this critical data, making it legally significant.
Literacy
- Literacy, as defined by the Indian census, is the ability to read and write with understanding. Anyone aged seven or above who can read and write in any one language is considered literate. The literacy rate, a crucial indicator of a country’s educational status and human development, is calculated as the percentage of literate persons in the population. India’s literacy journey has seen a significant rise from 18% at the commencement of the Indian constitution to 74.04% in 2011, and according to a 2022 report by the National Survey of India, it stands at 77.7%.

- Significance of Literacy
- Indicator of Human Development: Literacy rates are used globally to compare the educational levels of different countries and regions, directly influencing a nation’s socio-economic status.
- Educational Attainment: Higher overall literacy rates are associated with increased educational attainment across the population, enabling better employment opportunities and economic progress.
- Legal and Policy Frameworks: The UNESCO and National Literacy Mission definitions expand literacy to include not only reading and writing but also the ability to work, communicate, and participate effectively in society.
- Main Factors Affecting Literacy Rates in India
- Socio-Economic and Cultural Barriers: Poverty, gender inequality, and caste discrimination significantly impact literacy rates, with socio-economic disadvantages leading to lower educational attainment.
- Infrastructure Deficiencies: Inadequate facilities such as toilets, sanitation, and access to electricity and the internet in schools contribute to higher dropout rates, particularly among girls.

Quality of Education: The lack of a quality education system and proper guidance for students at schools and colleges leads to poor educational standards.
- Efforts to Improve Literacy
- New India Literacy Programme (2022-2027): Aimed at covering all aspects of adult education to align with the National Education Policy 2020. This programme focuses on foundational literacy and numeracy, life skills, vocational skills development, basic education, and continuing education, targeting 5 crore learners over five years.
- Online Volunteerism: Implementation through online platforms to reach non-literates aged 15 years and above across all states and union territories in India.
- Impact of Literacy on Society
- Economic Growth: Literate populations contribute to the economy’s growth by being more productive and innovative.
- Social Empowerment: Literacy empowers individuals, especially women, to make informed decisions about their lives and communities, leading to improved health and well-being.
- Reduction in Poverty: Education and literacy can break the cycle of poverty by providing individuals with the skills needed for better-paying jobs.
Literacy is not just about reading and writing; it’s a tool for individual empowerment, social development, and economic progress. The challenges to achieving universal literacy in India are multifaceted, involving socio-economic, cultural, and infrastructural factors. However, targeted programmes like the New India Literacy Programme, along with efforts to improve the quality of education and infrastructure, hold promise for significantly improving literacy rates and, by extension, the overall development of the country.
Sex Ratio
The sex ratio is a critical demographic indicator that reflects the number of females per thousand males in a given population. It serves as a fundamental measure of gender equity in society, indicating the balance or imbalance between male and female populations at any given time. Understanding the sex composition of a society is crucial for several reasons:
- Significance of Studying Sex Composition
- Demographic Insight: It reveals basic demographic characteristics, showing how socio-economic and cultural patterns influence gender balance.
- Equity Measurement: Acts as a significant social indicator for assessing gender equity within the population.
- Development Planning: Essential for various planning activities and analyzing demographic dynamics such as mortality, migration, and economic characteristics.
- Sex Ratio in India
- Historical Trends: From 1951 to 2011, the sex ratio in rural India has shown a slight decrease, while in urban India, there has been an increase, reflecting changing socio-economic conditions.
- State-wise Variations: Significant increases and decreases in sex ratios have been observed across different states and union territories, highlighting regional disparities.
- Extremes: Kerala boasts the highest sex ratio, whereas Haryana has the lowest among the states. In Union Territories, Puducherry has the highest, and Daman and Diu have the lowest sex ratios.
- Declining Sex Ratio: Analysis and Policy Implications
- Gender Equality: A core objective for sustainable development, gender equality enhances productivity and ensures better outcomes for future generations.
- Local Empowerment: Empowering women at the local level has shown positive impacts on public goods provision, addressing needs more pertinent to women.
- Societal Impact: The declining sex ratio, especially the child sex ratio, signifies deep-rooted gender biases and has profound implications for societal balance and human development.
- Factors Contributing to Declining Sex Ratio
- Preference for Male Child: Cultural and socio-economic preferences for male children lead to adverse practices like sex-selective abortions.
- Demographic Trends: Naturally, more males are born than females, but the imbalance is exacerbated by human interventions like female infanticide and feticide.
- Legislative Gaps: Laws like the Pre-conception and Pre-natal Diagnostic Techniques (Prohibition of Sex Selection) Act have been ineffective due to loopholes and poor implementation.
- Child Sex Ratio
- Definition: The number of girls per thousand boys aged 0-6 years, a critical indicator of gender bias at the earliest stage of life.
- Current Trends: National Family Health Survey data shows a concerning trend in the child sex ratio, indicating the need for targeted interventions.
- Initiatives and Solutions
- Beti Bachao Beti Padhao (BBBP): A government scheme aimed at addressing the declining child sex ratio and empowering women through education and equal opportunities.
The sex ratio is a vital demographic and social indicator, highlighting the state of gender equity in society. India’s varying sex ratio, with notable regional differences and a concerning decline in the child sex ratio, underscores the need for comprehensive policy reforms and societal change. Initiatives like Beti Bachao Beti Padhao represent steps towards addressing these disparities, aiming for a more balanced and equitable society.
Family Planning in India
India’s journey with family planning began in 1952 when it became the first country in the world to launch a National Programme for Family Planning. This initiative marked the beginning of a series of transformations in policy and program implementation, aimed at promoting reproductive health, and reducing maternal, infant, and child mortality and morbidity, alongside achieving population stabilization goals.
- Evolution of Family Planning Program
- 1952: Launch of the National Programme for Family Planning.
- Shift in Approach: Transition from a clinical to a reproductive child health approach.
- 2000: Introduction of the National Population Policy (NPP), emphasizing a holistic and target-free approach to reduce fertility.
- Thrust Areas Under Family Planning Program
- Mission Parivar Vikas: Targets high fertility districts across several states to improve contraceptive availability.
- Introduction of New Contraceptives: Injectable Contraceptive MPA (Antara Programme) and Centchroman to offer more choices.
- Spacing Methods: Focus on spacing between births.
- Postpartum Family Planning: Utilizing institutional deliveries to promote family planning.
- Community-based Distribution: Involving ASHAs to distribute contraceptives.
- Quality Care: Establishing Quality Assurance Committees for family planning services.
- Family Planning (FP) 2030 Partnership
- Global Initiative: FP 2030 serves as a platform for stakeholders to advance family planning globally.
- India’s Commitment: Investment of 3 billion USD and the addition of over 1.5 crore users of modern contraceptives.
- Findings of NFHS V – 2022
- Scope Expansion: NFHS-5 added new dimensions to the survey, including death registration, pre-school education, and Non-Communicable Diseases (NCDs).
- Sustainable Development Goals (SDGs): Provides data to track India’s progress towards SDGs.
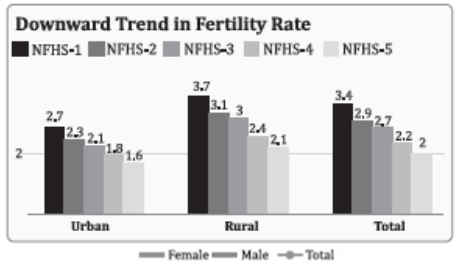
- Highlights of NFHS-5 on Population Trends
- Total Fertility Rate (TFR): Decrease from 2.2 to 2.0 nationally, with only five states above the replacement level of 2.1.
- Underage Marriages: Decrease in the percentage of women marrying before the legal age.
- Contraceptive Use: Increase in modern contraceptive use, especially among employed women.
- Socioeconomic Progress: Contraception use is higher in communities with greater socioeconomic progress.
- Achievements of SDG Goals
NFHS-5 shows overall improvement in SDG indicators across all states and Union Territories, highlighting increased participation of women in household decision-making and significant growth in the proportion of women owning a bank or savings account.
- Significance of Family Planning in India
Family planning in India is not just about population control; it’s a comprehensive approach toward improving the health and well-being of women, reducing child mortality, and achieving sustainable development goals. The program’s evolution from a purely clinical approach to a more holistic and inclusive strategy reflects the changing dynamics of Indian society and its needs. Through initiatives like Mission Parivar Vikas and partnerships like FP 2030, India aims to make family planning services more accessible and acceptable, thereby contributing to the overall development of the country.
Age Structure
The age structure of a population refers to the distribution of individuals across various age groups in relation to the total population. It is a critical demographic characteristic that provides insights into the economic productivity, dependency ratio, and overall demographic trends of a country.
- Significance of Age Structure
- Economic Productivity: The age structure determines the size of the working population (ages 15-60), which is crucial for the country’s economic development.
- Dependency Ratio: It highlights the proportion of dependent population (below 15 and above 60 years), affecting the economic burden on the working-age population.
- Demographic Trends: Changes in age structure reflect levels of development, healthcare quality, and life expectancy, influencing policies on education, healthcare, and social security.
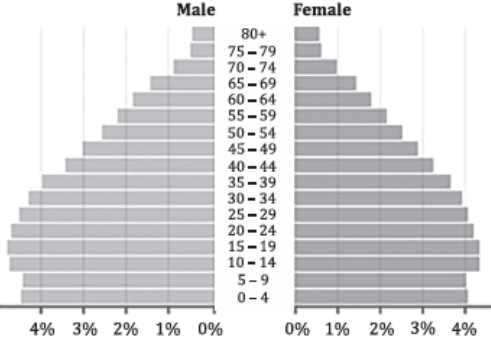
- Age Structure of India
- Youthful Population: India has a predominantly young population, with a significant proportion below the age of 30, leading to a lower average age compared to many other countries.
- Changing Trends: Over the decades, there has been a decrease in the proportion of the population aged 0-14, with a slight increase in the 15-59 age group, and a gradual rise in the 60+ age group.
- Future Projections: The age profile of the Indian population is expected to undergo significant changes, with a decrease in the share of the 0-14 age group and an increase in the share of the 60+ age group over the next two decades.
- Old Age
- Definition: Individuals in the 60+ age group are defined as elderly, with aging being a continuous and irreversible process from conception to death.
- Economic Dependency: The onset of old age is often associated with a decline in productive contribution and increased economic dependency.
- Population Figures on Aging
- Current Statistics: As of the 2011 Census, India had 104 million people aged 60+, constituting 8.6% of the total population, up from 5.5% in 1951.
- Rural vs. Urban Distribution: The majority of the elderly population resides in rural areas, with significant numbers also in urban neighborhoods.
- Projected Increase: The proportion of the elderly population is projected to rise to 19% by 2050.
- Feminization of Aging
- Increasing Sex Ratio: The sex ratio among the elderly has been increasing, indicating a higher proportion of women in the older age groups.
- Feminization Challenge: The feminization of aging poses unique challenges, as the number of very old women, many of whom are widowed and highly dependent, is expected to grow significantly, necessitating focused policy and programmatic attention.
The age structure of India’s population reveals a youthful demographic that is gradually aging. This shift has profound implications for economic development, social security, and healthcare systems. The increasing proportion of the elderly, particularly elderly women, presents unique challenges that require targeted policy interventions to ensure their well-being and economic security. Understanding and addressing the implications of these demographic changes are crucial for sustainable development and social equity in India.
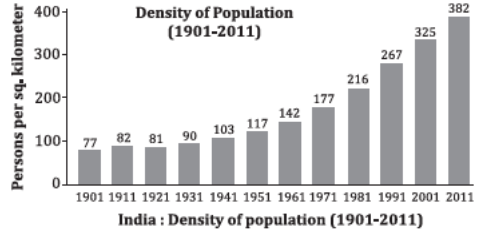
Population Density in India
Population density provides a clearer understanding of how populations are distributed across different regions. It’s calculated as the number of individuals living per square kilometer. India’s population density, as per the 2011 census, stood at 382 people per square kilometer. This number has been on a steady rise since 1921, raising concerns due to the associated challenges of overpopulation.
The distribution of population density in India is categorized into several classes based on the number of people living per square kilometer:
- Areas of Extremely Low Density: These areas have less than 100 people per square kilometer. Examples include Arunachal Pradesh (17 people/sq km), Mizoram (52), Andaman and Nicobar Islands (46), and Sikkim (86). These regions are often remote and inaccessible, contributing to their low population density.
- Areas of Low Density: Characterized by a population density of 101 to 250 people per square kilometer. States in this category include Nagaland (119), Manipur (122), and Himachal Pradesh (123), among others. These areas, particularly in the northeast and the Himalayan region, face geographical challenges that limit population density.
- Areas of Moderate Density: With 251 to 500 people per square kilometer, this category includes states like Odisha (269), Gujarat (308), and Karnataka (319). The moderate density is attributed to various factors, including agricultural and mineral resources, as well as sufficient land in certain areas.
- Areas of High Density: These areas have a population density of 501 to 1000 people per square kilometer. States like Punjab (550), Tamil Nadu (555), and Kerala (859) fall into this category, largely due to their agricultural productivity and, in some cases, industrial activities.
- Areas of Very High Density: Featuring more than 1000 people per square kilometer, regions like West Bengal (1029), Bihar (1102), and Delhi (11,297) exhibit the highest population densities. The fertility of the Ganges plain and industrial activities contribute to the high density in these areas.
Population Growth in India
India, with the world’s second-largest population after China, showcases significant urbanization and population density, especially in cities. From a historical perspective, India’s population has seen various phases of growth:
- Phase 1 (1901-1921): Known as the Period of Stagnant Population or the Primitive Demographic Transition Stage, this era experienced high birth and death rates, influenced by epidemics, famines, and droughts.
- Phase 2 (1921-1951): Marked as the Period of Steady Growth, improvements in medical interventions and food supply systems led to a reduced death rate and a steady population increase.
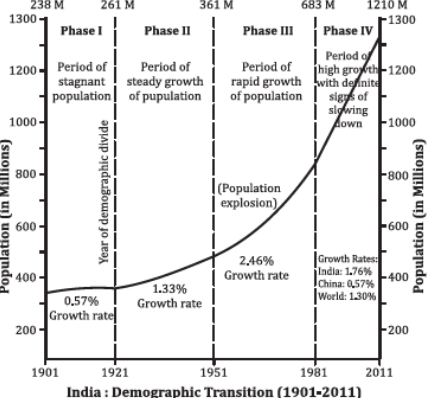
- Phase 3 (1951-1981): Termed the Period of Rapid Population Growth, significant advancements in health facilities and developmental activities caused a sharp decline in mortality rates while the fertility rate remained high.
- Phase 4 (1981-2011): This period observed High Population Growth Rate with signs of slowing down. There was a notable decline in both birth and death rates, indicating progress towards stabilizing the population growth.
The evolution of India’s population density and growth reflects a complex interplay of geographical, social, and economic factors. The ongoing challenge is to manage this growth sustainably, ensuring that development efforts are equitable and environmentally friendly.
- Spatial Pattern of the Growth Rate of India
India’s population growth rate exhibits significant spatial-temporal variations across different states and union territories, reflecting a diverse demographic landscape shaped by a range of socio-economic, cultural, and policy factors. These variations are crucial for understanding regional development needs, planning resource allocation, and implementing targeted population management strategies.
Variations in Growth Rate
- Southern States: Kerala, Tamil Nadu, and Andhra Pradesh are examples of states that have nearly stabilized their population growth rates. These states have experienced substantial demographic transitions, resulting in lower fertility rates and more stable population numbers.
- Northern Hindi Belt: States in the Northern Hindi belt, including Bihar, Jammu and Kashmir, and Uttar Pradesh, continue to exhibit very high growth rates. Bihar, for instance, has the highest growth rate at 25%, followed by Jammu and Kashmir at 23.7% and Uttar Pradesh at 20%.
- Smaller States and UTs: Among the smaller states and Union Territories, Dadar and Nagar Haveli and Daman and Diu have registered the highest growth rates of 55.5% and 53.54% respectively, indicating rapid population increases.
- Low Growth Rates: In contrast, territories like Lakshadweep, Andaman Nicobar Islands, and Goa have shown low growth rates, remaining in single digits. This suggests a different set of demographic dynamics compared to other regions.
- Notable Decline: Nagaland presents a unique case with a drastic fall in its growth rate from 64.53% between 1991 to 2001 to a negative growth rate of -0.47%, primarily due to factors such as conflicts, mortality, and out-migration.
- Comparison with Advanced Countries: Kerala, with the second minimum growth rate of 4.86%, has reached a higher level of demographic transition, aligning more closely with the demographic characteristics of advanced countries in Europe and America.
- High Growth in Populous States: Notable populous states like Bihar, Jammu & Kashmir, Chhattisgarh, and Jharkhand have recorded very high growth rates of over 20%, highlighting ongoing demographic challenges.
- Growth in Industrial and Urban Areas: Industrial and urban centers tend to grow faster due to high immigration driven by employment opportunities, leading to increased population densities in these areas.
Implications
- The spatial pattern of population growth rates in India underscores the need for differentiated policy approaches to manage demographic challenges effectively. States with high growth rates may require more focused interventions in family planning and reproductive health services, while those with stabilized populations might shift their focus towards managing aging populations and sustaining economic growth. Additionally, the migration patterns contributing to growth in industrial and urban areas necessitate urban planning and infrastructure development to accommodate increasing populations sustainably.
Census Terminology Explained
- A census is the complete enumeration of a population or groups at a point in time with respect to well defined characteristics: for example, population, production, traffic on particular roads. In some connection the term is associated with the data collected rather than the extent of the collection so that the term sample census has a distinct meaning.
- Rural and Urban Areas: In the Census of India 2011, the definition of urban area adopted is as follows:
- All statutory places with a municipality, corporation, cantonment board or notified town area committee, etc.
- A place satisfying the following three criteria simultaneously:
- A minimum population of 5,000.
- At least 75 percent of male working population engaged in non-agricultural pursuits.
- A density of population of at least 400 per sq. km. (1,000 per sq. mile).
- Cities: Towns with a population of 1,00,000 and above are called cities.
- Household: A ‘household’ is usually a group of persons who normally live together and take their meals from a common kitchen unless the exigencies of work prevent any of them from doing so. Persons in a household may be related or unrelated or a mix of both.
- Institutional Household: A group of unrelated persons who live in an institution and take their meals from a common kitchen is called an Institutional Household. Examples of Institutional Households are boarding houses, messes, hostels etc.
- Literates: A person aged 7 years and above who can both read and write with understanding in any language has been taken as literate. It is not necessary for a person to have received any formal education or passed any minimum educational standard for being treated as literate. People who were blind and could read in Braille are treated to be literates.
- Sex Ratio: Sex ratio has been defined as the number of females per 1000 males in the population. It is expressed as ‘number of females per 1000 males’.
- Child Sex-ratio (0-6 years): defined as the number of females in age-group 0-6 years per 1000 males in the same age-group in the population. It is expressed as ‘number of female children age (0-6) years per 1000 male children age (0-6) years’.
- Literacy rate of population: defined as the percentage of literates to the total population age 7 years and above.
- Work participation rate: defined as the percentage of total workers (main and marginal) to total population.
UPSC PREVIOUS YEAR QUESTIONS
1. “Demographic Dividend in India will remain only theoretical unless our manpower becomes more educated, aware, skilled and creative.” What measures have been taken by the government to enhance the capacity of our population to be more productive and employable? (2016)
2. As per the 1991 Census, which one of the following states has a lower population density than the other three? (1996)
(a) Sikkim (b) Nagaland|
(c) Meghalaya (d) Manipur
3. According to the latest census figures sex ratio in India is : (1997)
(a) declining (b) stable
(c) increasing (d) fluctuating
4. Which one of the following statements is true according to 1991 Census data? (2000)
- P. has the highest density of population in India
- Himachal Pradesh has the highest female to male sex ratio in India
- West Bengal has the highest growth rate of population in India
- Bihar has the lowest literacy rate in India
5. Which amongst the following States has the highest population density as per Census-2001? (2003)
(a) Kerala (b) Madhya Pradesh
(c) Uttar Pradesh (d) West Bengal
6. Consider the following statements : (2005)
Area-wise, Chhattisgarh is larger than West Bengal.
According to the population Census 2001, population of West Bengal is larger than that of Chhattisgarh.
Which of the statements given above is/are correct?
(a) 1 only (b) 2 only
(c) Both 1 and 2 (d) Neither 1 nor 2
7. Which one of the following statements is true on the basis of Census – 200l? (2005)
1. Bihar has the highest percentage of the scheduled castes of its population.
2. The decadal growth of population of India (1991-2001) has been below 20%.
3. Mizoram is the India state with the least population.
4. Pondicherry has the highest sex ratio among the Union Territories.
8. Consider the following statements: (2009)
1. Between Census 1951 and Census 2001, the density of the population of India has increased more than three times.
2. Between Census 1951 and Census 2001, the annual growth rate (exponential) of the population of India has doubled.
Which of the statements given above is/are correct?
(a) 1 only (b) 2 only
(c) Both 1 and 2 (d) Neither 1 nor 2