
POPULATION AND SETTLEMENT
Demography
-
- Demography is the scientific study of human populations, focusing on their size, composition, and distribution across different geographical locations. It involves analyzing how various population characteristics—such as total number, age structure, and spatial distribution—evolve over time. This field of study is crucial for understanding the dynamics of human societies and is instrumental in planning and policy-making. By examining changes in population size, distribution, and structure, demographers provide valuable insights that help governments, organizations, and scientists to make informed decisions.
Historical Context
- Demographic studies have a long and rich history, dating back to ancient civilizations where basic forms of censuses were conducted. These early efforts, some 6,000 years ago, were primarily aimed at understanding population size for tax collection and military conscription purposes. However, it was not until the 19th century that demography began to emerge as a structured field of study. This period marked a significant shift in demographic research, highlighted by observations of declining birth rates in several societies.
The Concept of Differential Fertility
- One of the pivotal concepts that emerged from early demographic studies is that of “differential fertility.” This concept posits that various subgroups within a larger population may exhibit different fertility rates due to a variety of factors, including but not limited to, religious beliefs, cultural norms, socioeconomic status, and employment conditions. Understanding differential fertility is vital for explaining variations in population growth rates among different societal groups and for developing targeted interventions to address specific demographic challenges.
Migration
- In addition to fertility and mortality, migration stands out as a fundamental component of demographic change. Migration refers to the movement of people from one area to another, which can significantly alter the size and composition of populations. Whether driven by economic opportunities, conflict, environmental factors, or personal choices, migration patterns have profound implications for both origin and destination areas. Analyzing migration flows is essential for understanding regional population dynamics, labor market trends, and the redistribution of resources.
The Triad of Population Change
- The interplay between mortality, fertility, and migration forms the core of demographic studies. These three variables collectively determine the direction and magnitude of population change. Mortality rates influence the size and age structure of a population, fertility rates determine the rate of population growth, and migration can either mitigate or exacerbate demographic trends. By examining these factors, demographers can forecast population trends, anticipate future challenges, and guide policy-making efforts aimed at sustainable development and social welfare.
Concept of Human Resources
Definition
- Human Resource Management (HRM) encompasses the strategies, practices, and policies employed to manage individuals in the workforce effectively. It aims to optimize employee performance in service of an employer’s strategic objectives while ensuring the workforce’s well-being and satisfaction. HRM covers a broad spectrum of activities, including recruitment, training, performance management, and employee relations.
Concept of Human Capital
- A subset of HR, Human Capital, refers to the aggregate knowledge, skills, and health that individuals invest in and accumulate throughout their lives, enabling them to contribute productively to society. This concept, as defined by the World Bank, emphasizes the role of education and health in enhancing individuals’ economic potential.
Human Capital and Economic Growth
- There is a direct correlation between human capital and economic growth. Investments in human capital, such as education and healthcare, boost economic productivity by expanding individuals’ capabilities and skills. A well-educated and healthy workforce can drive innovation, improve efficiency, and sustain economic expansion.
The Human Capital Index (HCI)
- The World Bank’s Human Capital Index (HCI) serves as a critical measure of how countries harness the potential of their human capital. The HCI evaluates countries based on educational attainment and health outcomes, reflecting the expected productivity of a child born today by the time they reach adulthood. Key indicators include adult survival rates, the prevalence of stunting in children, and gender disparities in human capital outcomes.
HCI and Its Relevance to India
- India’s performance in the HCI highlights both challenges and opportunities in leveraging human capital for economic development. Despite significant progress, a child born in India today will achieve only 44% of their productive potential if current education and health conditions persist. The HCI underscores the importance of addressing educational shortfalls and health issues to unlock the full potential of India’s population.
Key Metrics of HCI
- The HCI incorporates three primary metrics.
- The mortality rate of children under five years of age.
- The expected years of quality-adjusted schooling.
- The rate of stunting among children under five, indicative of malnutrition and its long-term effects on cognitive and physical development.
India’s ranking in the HCI, at 116th position with a score of 0.49 (according to 2021 data), reflects the need for sustained efforts to improve health and education outcomes.
The Human Capital Project
- The World Bank’s Human Capital Project represents a global initiative to enhance investments in human capital. By February 2022, 83 countries across different income levels have engaged with the World Bank Group to develop strategic approaches aimed at transforming their human capital outcomes. This initiative emphasizes the importance of equitable and effective investments in people to foster greater equity and stimulate economic growth.
Population Distribution
- Population distribution refers to the spatial arrangement of individuals within a particular species or group across different areas of the Earth’s surface. It is a critical aspect of demographic studies, geography, and environmental science, providing insights into how and why populations are spread in various patterns globally. This distribution is influenced by a myriad of factors ranging from environmental to socio-economic, each playing a distinct role in shaping the density and dispersion of populations.
Characteristics of Populations
- A population is a collection of individuals from the same species that live and reproduce within a certain area. These populations rely on similar resources, face common environmental challenges, and depend on the presence of other members for their continuity and survival. The study of population distribution, therefore, examines how these groups are geographically dispersed and what factors contribute to their specific patterns of settlement.
Patterns of Population Distribution
- Geographical patterns of population distribution are studied across various scales including local, regional, national, and global levels. One of the most striking aspects of population distribution is its unevenness; approximately 90% of the world’s population resides in just 10% of the land area. Moreover, the ten most populous countries account for about 60% of the global population, with six of these countries located in Asia, highlighting significant regional disparities in population density.
Factors Influencing Population Distribution
Geographical/Physical Factors
- Availability of Water: Regions with abundant freshwater resources, such as river valleys, are heavily populated due to their suitability for human habitation and agriculture.
- Soil Quality: Fertile soils support agriculture, which in turn supports large populations. Areas with high-quality soil, such as the Ganga Valley, are densely populated.
- Landforms: Flat plains and gentle slopes are preferred for settlement due to their agricultural potential and ease of building infrastructure.
- Climate: Mild climates are more favorable for settlement, while extreme conditions discourage dense populations.
- Natural Disasters: Frequent natural disasters deter settlement in certain areas due to the risk of destruction and loss.
Socio-cultural Factors
- Social Organization: The formation of communities and social networks encourages population growth in certain areas.
- Political Stability: Regions with stable governance are more attractive for settlement than those with conflict or unrest.
- Religious and Cultural Significance: Certain locations hold spiritual or cultural importance, attracting settlements around these areas.
Economic Factors
- Mineral Resources: Areas rich in minerals attract industries and workers, leading to higher population densities.
- Urbanization: Urban centers, with their diverse job opportunities and amenities, draw people from rural areas, leading to increased urban population density.
- Industrialization: Industrial regions offer employment opportunities, contributing to population growth in these areas.
- Demographic Factors
- Demographic characteristics such as fertility, mortality, and migration patterns directly influence population distribution. Natural increase rates, driven by the balance between fertility and mortality, alongside migration trends, shape the density and demographic composition of regions.
World Population Distribution
- The global population has seen a remarkable increase, rising from 1 billion in the year 1800 to an estimated 7.9 billion today. This unprecedented growth has been accompanied by a notable decrease in the population growth rate, which has fallen from 2.2% per year five decades ago to approximately 1.0% per year in recent times. Such changes in population dynamics have significant implications for resource distribution, environmental sustainability, and global development strategies.
Global Distribution of Population
The distribution of the world’s population is uneven and can be analyzed from various perspectives, including continental distribution, latitudinal patterns, and hemispherical occupancy.
Distribution According to Continent
- Asia: As the most populous continent, Asia houses around 60% of the world’s population, with India and China together accounting for 36%. The sheer size of the population in Asia has profound effects on the global economy, environment, and cultural exchange.
- Africa: Ranking second, Africa comprises over 17% of the global population. Countries like Nigeria and Ethiopia are among its most populous, reflecting a diverse and rapidly growing demographic landscape that presents both challenges and opportunities for development.
- Europe: Europe holds more than 10% of the world’s population, with countries such as France, the U.K., Italy, Spain, and Ukraine being notably populous. Despite its smaller size compared to Asia and Africa, Europe plays a crucial role in global affairs, partly due to its historical and economic significance.
- Latin America and the Caribbean: This region is home to approximately 8% of the global population, spanning across numerous countries and territories, including Mexico, Brazil, and Argentina. The diverse cultures and economies in this region contribute significantly to the global community.
- North America: The United States and Canada together constitute about 5% of the world’s population, making it a region with significant economic and cultural influence on a global scale.
- Oceania: The least populated region, Oceania, is comprised of thousands of islands in the Central and South Pacific Ocean, including Australia. Its unique ecosystems and cultures make it an area of interest for environmental and anthropological studies.
Distribution According to Latitude
- 20-40 Degrees North Latitude: This band, encompassing a variety of climates including the Mediterranean, East and West coast climates, and grasslands, is where approximately 50% of the world’s population resides.
- 40-60 Degrees North Latitude: Around 30% of the global population lives within this latitudinal range, which includes many temperate regions conducive to human habitation and agriculture.
- Beyond 60 Degrees North Latitude: Only about 1% of the population lives beyond 60 degrees north, reflecting the harsh climatic conditions and limited habitability of these areas.
- Distribution According to Hemisphere
- The Northern Hemisphere is the primary residence for about 90% of the Earth’s population. This demographic skew towards the northern part of the globe is due to the distribution of land mass, which is more concentrated in the Northern Hemisphere, encompassing the entirety of Europe and North America, the majority of Africa and Asia, and parts of South America.
Population Density
Population density is a critical metric used to quantify the number of individuals living per unit of area, typically measured per square kilometer. This concept, a form of number density, is predominantly applied to humans but can also refer to other living organisms. It serves as an essential tool for understanding how populations are distributed across different geographic regions and can have significant implications for resource allocation, urban planning, and environmental sustainability.
- At its core, population density is calculated by dividing the total population of a region by the area it occupies. The formula is straightforward: Density of Population = Population/Area
- This formula yields a value that represents the number of people living in each square kilometer of the area in question. Population density is expressed in various ranges to categorize regions from sparsely to densely populated. These ranges can be as follows:
- 0-25 persons/km²: Extremely low density, typically found in inhospitable regions.
- 25-75 persons/km²: Low density, common in rural or wilderness areas.
- 75-150 persons/km²: Moderate density, characteristic of suburban areas.
- 150-300 persons/km²: High density, often found in urban areas.
- 300-500 persons/km²: Very high density, usually in large cities.
- 500-700 persons/km²: Extremely high density, in populous city centers.
- 700-1500 persons/km²: Exceptionally high density, typical of overcrowded cities.
- 1500-9000 persons/km²: Extraordinarily high density, seen in the world’s most dense urban areas.
Global Distribution and Trends
- As of the early 21st century, the global population reached approximately 6 billion, with current estimates surpassing 8 billion. Population density varies significantly across the globe due to environmental conditions, historical developments, and socio-economic factors.High-density regions include northeastern and northwestern Europe, south, southeast, and East Asia, where the density often exceeds 200 persons per square kilometer. Low-density regions are typically found near the poles, in deserts, and in high rainfall equatorial zones, with densities as low as 10 persons per square kilometer.
- Medium-density regions such as west China, southern India, Norway, and Sweden exhibit densities ranging from 11 to 50 persons per square kilometer.
Trends in Population Growth
- The world’s population growth has experienced a dramatic increase over the past few centuries, accelerating from a slow pace to a rapid expansion due to technological advancements and improvements in healthcare and agriculture.
- Historical Growth: From a mere 8 million people at the advent of agriculture around 8000 to 12000 years ago to under 300 million in the first century A.D., the global population has surged, particularly during the last few hundred years.
- Impact of Trade and Technology: The expansion of world trade during the 16th and 17th centuries, alongside technological innovations like the steam engine and advances in medical science, set the stage for unprecedented population growth.
- Modern Era: The global population reached 7.8 billion by mid-2020, with the growth rate peaking at 2.3% in the late 1960s before declining to an average annual growth rate of approximately 1.1% during 2015–2020.
Doubling Time of World Population
- The concept of “doubling time” refers to the period it takes for a given quantity to double in size or value. In the context of the world population, it illuminates how rapidly the number of human inhabitants on the planet is increasing. The rate at which the world’s population doubles has been experiencing significant changes over time, indicative of broader demographic trends and shifts.
Historical Perspective
- Early Growth: It took humanity over a million years to reach the 1 billion population mark.
- Accelerated Growth: Remarkably, the population soared from 5 billion to 6 billion within just five years, underscoring a rapid acceleration in growth rates. Currently, the doubling time of the world population is diminishing quickly, signaling an era of unprecedented population growth.
Developed vs. Developing Countries
- Growth Disparities: Developed countries are experiencing slower population growth compared to developing countries. The bulk of global population increase is now occurring in the developing world, highlighting a significant divide in population dynamics based on economic development levels.
Spatial Pattern of Population Change
- The spatial distribution of populations and changes therein play a crucial role in understanding demographic dynamics. It involves analyzing how populations are spread out across different geographical areas and the density of populations within these areas.
Definitions
- Spatial Distribution: This term refers to the geographical spread of populations, ranging from large scales (continents, oceans) to smaller scales (local habitats).
- Population Density: Contrasts with spatial distribution by focusing on the number of individuals within a specific area, providing a measure of concentration.
Case Study: India
India’s population dynamics offer a vivid illustration of spatial population change:
- Population Size: As of the 2011 Census, India’s population was 1210.19 million, with a gender distribution of 51.54% males and 48.46% females. Uttar Pradesh, the most populous state, has a population exceeding that of Brazil.
- Uneven Distribution: The population is distributed unevenly across states and districts, with significant concentration in Uttar Pradesh, Maharashtra, Bihar, West Bengal, and Andhra Pradesh. These states collectively harbor about half of the nation’s population.
- Index of Concentration: This measure highlights the uneven character of population distribution across Indian states, with significant disparities in population percentages.
Impacts of Population Change
Population change, particularly growth, has multifaceted impacts on society and the environment, including:
- Economic Growth: While a moderate increase can be beneficial for a growing economy, excessive growth may lead to various challenges.
- Resource Depletion: Rapid population growth can lead to the depletion of resources that were previously sufficient, impacting sustainability.
- Health Issues: Epidemics like HIV/AIDS have influenced mortality rates and life expectancy, affecting overall population dynamics.
Causes of Overpopulation
- Several factors contribute to overpopulation, including:
- Reduction in Mortality: Advances in healthcare and agriculture have decreased death rates while birth rates remain high, leading to population growth.
- Agricultural Advances: Innovations in farming have increased food production, supporting larger populations.
- Healthcare Facilities: Improvements in medical science have significantly reduced death rates from previously fatal diseases.
- Poverty and Lack of Education: Poverty and a lack of education, particularly in developing countries, contribute to high birth rates and overpopulation.
Impacts of Population Growth
The effects of rapid population growth are widespread, affecting natural resources, the environment, socio-economic stability, and health:
- Natural Resource Depletion: Increased demand for resources due to population growth leads to environmental degradation.
- Environmental Pollution: Industrial and vehicular emissions contribute to air pollution and global warming.
- Conflict over Resources: Competition for scarce resources can lead to disputes and conflicts.
- Unemployment and Higher Cost of Living: Overpopulation exacerbates unemployment and increases living costs, leading to socio-economic strains.
Present Global Trends and Future Projections of Population
- The dynamics of global population trends and future projections provide crucial insights into the demographic changes that the world is expected to undergo in the coming decades. These changes are influenced by a variety of factors including fertility rates, mortality rates, life expectancy, and migration patterns. Understanding these trends is essential for policy-making, planning, and addressing the challenges and opportunities that lie ahead.
UN Population Report Findings
According to the United Nations Population Report, the global population is on a trajectory to reach significant milestones in the coming years:
- 2030: Expected to hit 8.5 billion.
- 2050: Projected to increase to 9.7 billion.
- 2100: Anticipated to reach 11.2 billion.
Rapid Growth in Africa
- Africa is poised to be at the forefront of global population growth, with more than half of the increase up to 2050 expected to occur on the continent. Sub-Saharan Africa, in particular, is projected to see its population double by 2050, highlighting the region’s high rate of population growth compared to other major areas.
Reduction in Developed Countries
- In contrast, 55 countries or areas worldwide are projected to experience population declines by 2050, with significant reductions anticipated in countries like Bosnia and Herzegovina, Bulgaria, Croatia, Hungary, and Japan.
Global Growth Trends
- The global population growth rate is slowing, with projections indicating growth to around 10.4 billion by 2100. The rate of growth fell under 1% per year in 2020 for the first time since 1950.
Varied Growth Rates
- Population growth rates vary significantly across countries and regions. Notably, more than half of the projected global population increase up to 2050 will be concentrated in eight countries: the Democratic Republic of the Congo, Egypt, Ethiopia, India, Nigeria, Pakistan, the Philippines, and the United Republic of Tanzania.
Aging Populations
- The global demographic is aging, with the share of the population aged 65 years or above projected to rise from 10% in 2022 to 16% in 2050. This shift necessitates adaptations in public programs to cater to an older demographic.
Impact of International Migration
- International migration has significantly impacted population trends in high-income countries, with the net inflow of migrants exceeding the balance of births over deaths between 2000 and 2020.
Projection for India
- India is projected to surpass China as the world’s most populous country in 2023, according to the 2022 edition of the United Nations’ World Population Prospects (WPP).
Economic Implications and Quality of Life
- The shift in age distribution presents a time-bound opportunity for accelerated economic growth, known as the “demographic dividend.” The focus is shifting from concerns over overcrowding to improving the quality of life, including reducing poverty and enhancing access to healthcare and education.
Determinants of Population Growth
- The determinants of population growth is crucial for addressing the future challenges and opportunities associated with demographic changes:
- Fertility: The number of children born to women, which affects the population size and growth rate.
- Mortality: The death rate within a population, influencing the overall population size and life expectancy.
- Life Expectancy: The average number of years a person is expected to live, which has implications for the aging population and healthcare needs.
- Migration: The movement of people across borders, affecting the population size and composition in different regions.
Fertility
- Fertility, the occurrence of births within a population over a specified period, stands as a pivotal determinant of population growth dynamics. This concept encompasses various dimensions, with the Crude Birth Rate (CBR) and General Fertility Rate (GFR) being its primary quantitative measures. Understanding these rates is crucial for demographic analysis, policy formulation, and the implementation of population control strategies, especially in developing and underdeveloped countries.
Key Measures of Fertility
- Crude Birth Rate (CBR): The Crude Birth Rate is a fundamental demographic indicator that measures the number of live births per 1,000 people in a population over a year. It is calculated using the formula:
- CBR = (Bi/P) * 100 (Bi = Number of live births during the year, P = Mid-year population of the area)
- CBR provides a gross estimate of fertility within a population, offering insights into the population growth rate without accounting for the age or sex distribution of the population.
- General Fertility Rate (GFR): The General Fertility Rate offers a more refined measure of fertility by focusing specifically on the segment of the population that is biologically capable of reproduction. It is defined as the number of live births per 1,000 women of reproductive age (usually aged 15-49 years) in a year and is calculated as follows:
- GFR = B/P × 1,000 (B is the no. of birth per year, P refers to the number of productive women)
- GFR provides a more accurate assessment of the actual reproductive performance of a population by concentrating on the fertility of women in their childbearing years.
Fertility Trends and Implications
The decline in fertility rates has been a focal point of policy interventions in developing and underdeveloped countries, aimed at curbing rapid population growth. Several strategies have been identified as effective in achieving this goal:
- Improvement of Mass Education: Enhanced educational opportunities, especially for women, are correlated with lower fertility rates. Education empowers women with knowledge about reproductive health and access to family planning resources.
- Reduction of Child Mortality: Lower child mortality rates tend to reduce fertility rates as families do not feel the need to have additional children to ensure that some survive to adulthood.
- Expansion of Family Planning Programs: Access to contraception and reproductive health services enables couples to plan their families and reduce unintended pregnancies.
- Economic Growth and Employment Opportunities: Economic development and the creation of job opportunities can lead to lower fertility rates as people, particularly women, may choose to delay childbearing in favor of employment.
Comparative Fertility Rates
- The fertility rates between developed and developing countries exhibit significant disparities. In developed countries, the average fertility rate per woman stands at approximately 1.6, reflecting lower birth rates often associated with higher levels of income, education, and access to healthcare. In contrast, developing countries report a higher average fertility rate of around 3.1, attributed to various socio-economic factors including limited access to education and family planning services.
Mortality
- Mortality refers to the incidence of death within a population. It is a crucial indicator of the health and vitality of a population, reflecting the number of individuals who pass away within a specific time frame.
- Crude Death Rate (CDR) is a primary measure of mortality. It is defined as the number of deaths occurring in a particular year per thousand individuals in a given population. The formula for calculating CDR is:
CDR = (D/P) * 100 (D = number of deaths, P= Estimated mid-year population of that year)
Significance of Mortality Rates
- Population Growth: Mortality rates directly influence the growth dynamics of a population. A decrease in mortality usually contributes to population growth, assuming birth rates remain constant.
- Health Standards: Mortality rates reflect the general health of a population. Higher rates may indicate poor health conditions, while lower rates suggest better health services and living conditions.
- Socioeconomic Conditions: They also mirror the socioeconomic status of a community, revealing insights into the economic conditions, nutrition levels, and overall development.
Low Mortality Rate Implications
- Enhanced health facilities and access to medical care
- Reduced child mortality rates
- Effective measures against epidemics and diseases.
Life Expectancy
- Correlation with Economic Development Life expectancy is closely linked to the economic development of a country. Generally, more developed nations boast higher life expectancy rates due to better access to healthcare services, nutrition, and living conditions.
- Global Trends Over the past few decades, there has been a significant increase in life expectancy worldwide, a change largely attributed to advancements in medical science, such as the introduction of antibiotics and improved health facilities.
Historical Perspective
- In 1975, the global average life expectancy at birth was approximately 59.7 years.
- By 1999, this figure had risen to 65.6 years, with the most significant increases observed in the developing countries of Asia, where life expectancy jumped from 58.5 years in 1975 to 66.2 years in 1999.
Regional Variations
- Developed Regions: In these areas, life expectancy now stands at 71.2 years for males and 78.6 years for females.
- Developing Countries: Here, the figures are slightly lower, with life expectancies of 62.4 years for males and 65.3 years for females.
- Underdeveloped Countries: Contrastingly, in underdeveloped regions, life expectancy is markedly lower, at 51.5 years for males and 53.6 years for females.
Migration
To elaborate and present the information about migration in a detailed table format, we can organize the key points around the definitions of migration, types of migration, and factors influencing migration. This structure will help to clarify the complex dynamics of migration, including the concepts of immigration and emigration, as well as the push and pull factors that drive migration.
| Category | Detail |
| Definition | Migration is the movement of people from their place of origin to a new destination, leading to population shifts. |
| Types | Temporary: Migration for a limited time period. |
| Permanent: Relocation with no intention to return to the place of origin. | |
| Seasonal: Migration based on seasonal demand or conditions. | |
| Rural to Rural: Movement within rural areas. | |
| Rural to Urban: Movement from rural areas to urban centers. | |
| Urban to Urban: Relocation between urban areas. | |
| Immigration | The international movement of people into a country where they are not natives to settle as permanent residents. |
| Emigration | The act of leaving one’s resident country or place with the intent to settle elsewhere. |
| Push Factors | Poverty, lack of services, low wages, unhappy life, poor transport, natural calamities, political instability. |
| Pull Factors | Better employment, health services, education, higher wages, entertainment, better transport, improved living conditions, family links. |
Natural Increase of Population
Definition and Importance
- The natural increase of a population is defined as the difference between the number of births and the number of deaths within a given period. This metric serves as a crucial indicator of a population’s growth rate, excluding other factors like migration. When the number of births exceeds the number of deaths, the population is said to experience a surplus or increase.
Determinants and Range
- The potential range for the rate of natural increase is relatively narrow due to the inherent fertility and mortality characteristics of the human species. Factors excluding catastrophic events such as major disasters or pandemics typically define this range. The fertility rate (average number of children born per woman) and the mortality rate (number of deaths per 1,000 individuals per year) are key determinants.
Historical and Geographic Variations
- Kenya in the 1980s: Kenya experienced the highest recorded natural increase rate for a national population, with a rate of approximately 4.1 percent per annum. This exceptional growth was due to a high birth rate coupled with a relatively low death rate.
- Developing Countries: During the same period, other developing countries generally exhibited lower rates of natural increase, averaging about 2.5 percent per annum. Factors contributing to these rates include varying levels of access to healthcare, education, and family planning services.
- Industrialized Countries: In contrast, industrialized nations show much lower rates of natural increase, often around 1 percent or lower. Several factors, including better access to healthcare, higher education levels, and effective family planning, contribute to lower birth rates. Some industrialized countries even have slightly negative growth rates, indicating a declining population.
Implications and Challenges
- The rate of natural increase has significant implications for a country’s socio-economic environment. High rates of natural increase can strain resources, infrastructure, and social services, necessitating substantial investments in education, healthcare, and employment opportunities. Conversely, low or negative rates of natural increase pose challenges related to an aging population, sustainability of social security systems, and the need for policies to stimulate population growth or manage demographic changes effectively.
Trends of Migration in India
- Migration, the movement of people away from their usual place of residence, plays a significant role in shaping demographic patterns, economic development, and social structures within India. According to the 2011 Census, India witnessed a significant increase in the migrant population, highlighting diverse internal and international migration trends.
Key Statistics and Patterns
- Population of Migrants: In 2011, India had 45.6 crore migrants, making up 38% of the population, a significant increase from 31.5 crore migrants in 2001 (31% of the population).
- Rate of Increase: The number of migrants rose by 45% between 2001 and 2011, against an 18% population growth, with 99% of migration being internal.
- Internal Migration Patterns: Classified into rural-rural, rural-urban, urban-rural, and urban-urban, with rural-rural migration accounting for 54% of internal migration.
- Intra-state vs. Inter-state: Intra-state movement represented 88% of internal migration. Uttar Pradesh and Bihar were major sources of inter-state migrants, with Maharashtra and Delhi being key destinations.
Reasons for Migration and Migrant Labour Force
- Marriage and Family: The primary reason for intra-state migration, especially among females (83%), while work-related movement was more prevalent among males.
- Work: Significant among inter-state migrants, with 50% of male and 5% of female inter-state migrants moving for work.
- Underestimation of Migrant Workers: Official figures likely underestimate the true size of India’s migrant labour force, with the Economic Survey 2016-17 suggesting a larger number than reported by the Census.
Challenges Faced by Migrants
- Social Security and Health Benefits: Migrants often face a lack of social security, health benefits, and minimum safety standards.
- Portability of Benefits: The lack of portability for state-provided benefits, including the Public Distribution System (PDS), poses significant challenges.
- Housing and Amenities: Migrants struggle with accessing affordable housing and basic amenities, contributing to the growth of informal settlements.
Legislative and Policy Responses
- Inter-State Migrant Workmen Act, 1979: Despite provisions for protecting migrant workers, implementation has been poor, with low registration of workers and inadequate enforcement.
- Prime Minister Awas Yojana (PMAY): A scheme aimed at providing affordable housing to the economically weaker sections and low-income groups, addressing one of the critical needs of migrants.
Characteristics of Population
- Understanding the composition of a population is crucial for grasping the dynamics of social and economic situations in any given area. The composition can be analyzed through various characteristics, such as age, sex, marital status, education, occupation, and the relationship to the head of the household. Among these, age and sex compositions are the most commonly utilized metrics due to their significant impact on societal structures and economic conditions.
Sex Composition
- The sex composition of a population is quantified through the sex ratio, which is the number of males per 1000 females in the population. This measure provides insights into gender distribution within a society.
Implications of Sex Ratio
- Gender Discrimination: Regions with a skewed sex ratio, particularly unfavorable to women, may indicate prevalent gender discrimination, including practices like female foeticide, infanticide, and domestic violence.
- Socio-economic Status: An unfavorable sex ratio can also reflect the lower socio-economic status of women in certain areas.
Global and Regional Statistics
- The world average sex ratio stands at approximately 101.68 males to 100 females as of 2022.
- Nepal and Hong Kong represent the extremes, with the highest and lowest sex ratios, respectively.
- Asia is noted for having a particularly low sex ratio, while in Europe (including Russia), males are a minority.
- In India, the 2020 figures showed a sex ratio of 108.18 males per 100 females, with a female population percentage of 48.04%.
Age Composition
- Importance The age composition of a population is determined by the number of individuals within different age groups. This composition is crucial for understanding the demographic makeup and potential future trends of a population.
Indicators of Age Composition
- Working Population: A large number of individuals aged 15-59 indicates a sizable working-age population.
- Aging Population: A significant proportion above 60 years suggests an aging population, necessitating increased healthcare expenditures.
- Youthful Population: A high percentage of young individuals points to a high birth rate and a youthful population demographic.
Population Pyramids
- Description Population pyramids graphically represent the age and sex distribution of a population, offering insights into birth and death rates, as well as potential future trends.
Types of Population Pyramids
- Expanding Population: Characterized by a wide base, indicating high birth rates, commonly seen in less developed countries.
- Declining Population: Features a narrow base and tapered top, reflecting low birth and death rates, typical of developed countries.
- Constant Population: Exhibits a bell shape, suggesting birth rates are nearly equal to death rates, leading to a stable population size.
Literacy
- Indicator of Development Literacy rates are a significant indicator of a country’s socio-economic development, revealing information about living standards, the social status of females, availability of educational facilities, and government policies.
- Economic Development and Literacy There is a reciprocal relationship between literacy and economic development, where each influences the other.
- Linguistic Composition India’s linguistic diversity is vast, with Hindi being the most widely spoken language, followed by Bengali, Marathi, Telugu, and Tamil, among others.
- Religious Composition India is home to a rich diversity of religions, with significant populations of Hindus, Muslims, Christians, Sikhs, Buddhists, Jains, and others. The country’s secular constitution guarantees the right to practice any religion.
Concepts of Over, Under, and Optimum Population
The concepts of overpopulation, underpopulation, and optimum population challenge the dire outlook presented by Malthus’s theory of population growth. These concepts explore the relationship between the size of a human population and the availability of resources in specific regions. Unlike the Malthusian perspective, which sees population growth as inherently negative due to its potential to exceed the Earth’s carrying capacity, these concepts suggest that population dynamics can have varied impacts on a country’s development and resource utilization.
Optimum Population
- Definition: Optimum population refers to the ideal population size where the highest standard of living is achievable. At this level, the resources available in a region are used most effectively, leading to the greatest possible economic benefit per capita.
- Characteristics: The economy functions at its peak efficiency, balancing population size with resource availability. This balance ensures that each individual has access to a maximum share of resources, contributing to a high standard of living.
- Examples: Economies that manage to strike a balance between their population size and resource exploitation without compromising the quality of life or the environment may be considered to have achieved an optimum population. This concept is theoretical and varies by the specific context of each country, considering factors like technological advancement and resource distribution.
Under Population
- Definition: A region is considered underpopulated when its population size is too small to fully exploit and develop its resources. In such cases, an increase in population could lead to better utilization of resources, potentially increasing per capita income and improving living standards.
- Indicators: Key indicators include a surplus of resources relative to the population size, low levels of economic development due to a lack of human capital, and potentially high per capita income that could rise further with population growth.
- Reasons: Factors leading to underpopulation may include a high death rate, insufficient technological development to exploit resources, or a low birth rate.
- Examples: Countries like Canada and Russia, with vast land resources relative to their population sizes, are often cited as examples of underpopulation.
Over Population
- Definition: Overpopulation occurs when a region’s population exceeds the capacity of its environment and resources, leading to a decrease in living standards and per capita income. This situation is characterized by resource scarcity, where the demands of the population surpass what the environment can sustainably provide.
- Indicators: Signs of overpopulation include widespread hunger, malnutrition, low levels of social development, agricultural stress, environmental degradation, and conflicts over resources.
- Reasons: Causes of overpopulation can include high rates of population growth, depletion of natural resources due to overuse or mismanagement, and environmental changes that reduce the availability of water or the productivity of land.
- Examples: Regions experiencing rapid population growth without adequate increases in resource management, technological innovation, or infrastructure development may suffer from overpopulation. This includes certain areas where rapid urbanization has outpaced the development of services and infrastructure.
Analysis and Application
These concepts provide a framework for analyzing the relationship between population size and resource availability. They suggest that:
- Not all population growth is detrimental. In cases of underpopulation, increased population growth can stimulate economic development and better resource utilization.
- There’s an optimal population size where economic output and living standards are maximized, considering the available resources and technology.
- Overpopulation is a critical concern when it leads to resource depletion, environmental degradation, and declining living standards.
Population Problems in Developing and Developed Countries
Population dynamics and their associated challenges vary significantly between developing and developed countries, shaped by differences in social, economic, and cultural systems. These variations give rise to distinct sets of problems that each group of countries faces.
Developing Countries
Developing countries, such as India, Pakistan, Bangladesh, China, Myanmar, Nepal, Indonesia, Malaysia, the Philippines, and others, face a myriad of population-related challenges:
- Low Levels of Technological Development: Many developing countries struggle with low productivity levels due to inadequate technological advancement. This contributes to slow economic growth, which, in turn, exacerbates rapid population growth.
- Low Population Levels in Resource-rich Areas: Countries like Brazil, Colombia, Peru, Zaire, and several nations in Central Asia possess vast natural resources yet suffer from underpopulation in certain areas, leaving these resources untapped due to a lack of human capital.
- Youth Population Pressure: Improved healthcare has led to a demographic shift towards a younger population. This puts pressure on the comparatively smaller working-age population to support the young, leading to economic and social strains.
- Lack of Economic Diversification: The absence of significant development in the secondary and tertiary sectors results in limited job opportunities, driving skilled workers to seek employment in more developed areas or abroad.
- Undernourishment and Poor Hygiene: Poor living conditions and low standards of living contribute to high rates of disease and mortality, particularly among children and pregnant women.
- Inefficient Agricultural Sector: Many developing countries rely on traditional farming methods, suffer from fragmented land holdings, and face capital shortages, making their agricultural base weak.
- Weak Industrial Base: Outdated technology, lack of capital, and insufficient skilled manpower hinder the development of a strong industrial sector, impeding improvements in living standards.
- Tradition-bound Societies: Cultural norms and traditions, such as the caste system in India, can inhibit social mobility and restrict the adoption of family planning and birth control measures.
- Underpopulated Areas: Both within populous countries and as separate nations, underpopulated areas present challenges for economic investment in infrastructure, leading to rural-urban disparities.
- Unfavorable Physical Conditions: Harsh climatic and topographical conditions in many populous countries obstruct development efforts and make overcoming these challenges costly.
Developed Countries
Developed countries, including the USA, Canada, the UK, Japan, and others, face their own set of population challenges, despite higher levels of industrialization and urbanization:
- Aging Population: Low mortality rates and high life expectancy lead to a high proportion of the population being elderly, placing financial strains on healthcare and pension systems.
- Labor Shortage: Improvements in education mean children spend more time in school, delaying their entry into the workforce and leading to labor shortages in many European countries.
- Urban Migration: The search for better living conditions drives migration to cities, leading to demographic imbalances and neglect of the agricultural sector.
- Urban Congestion: Expansion of urban areas puts pressure on civic amenities, leading to pollution, social tensions, and health issues such as heart and respiratory diseases.
- Growth of Slums: Unregulated urban growth results in the proliferation of slums, creating environmental and social problems, including the encroachment on agricultural land.
Population Policies of India
Pre-Independence Period
- Period of Indifference: The British colonial rulers largely ignored the burgeoning population growth in India, showing little interest in implementing birth control measures. Their apathy stemmed from a reluctance to interfere with Indian values, beliefs, customs, and traditions, leading to what is often described as the “Period of Indifference.”
- Indian Intelligentsia’s Awareness: Contrary to British apathy, the Indian intelligentsia recognized the potential problems associated with unchecked population growth. Prominent figures and intellectuals like P.K. Wattal, who published a book on birth control in 1916, R.D. Karve, Rabindranath Tagore, P.N. Sapru, and Jawaharlal Nehru, advocated for the adoption of birth control measures.
- Gandhiji’s View: Mahatma Gandhi acknowledged the importance of birth control but favored natural methods such as self-control, abstinence, and timing (safe period) over artificial means, highlighting a culturally sensitive approach to population control.
- Preparation for Post-Colonial Policy: The Indian intelligentsia, during the final years of British rule, laid the groundwork for future birth control policies, as noted by Prof. Gunnar Myrdal, who recognized the intellectual preparation related to birth control during this period.
The Period of Neutrality (1947-1951)
- Post-Independence Challenges: Immediately following independence, India faced numerous pressing challenges, including rehabilitation after partition, state reorganization, and the invasion of Kashmir by Pakistan. These issues consumed the government’s attention, leaving little room for the development of population stabilization policies.
- Planning Commission and Nehru’s Role: Despite the overarching challenges, the importance of family planning was acknowledged by key figures like Jawaharlal Nehru. During a Planning Commission meeting in 1949, Nehru emphasized the need for a family planning program in India, indicating an early recognition of the issue at the highest levels of government.
- Absence of Stabilization Policies: In the immediate post-independence period, characterized by neutrality towards population issues, India did not adopt any specific population stabilization policies. This period served as a transition phase, setting the stage for more active interventions in the years to come.
Subsequent Developments
- Following the period of neutrality, India gradually moved towards more proactive population control and family planning measures. The government began to implement policies aimed at stabilizing population growth through various family planning initiatives, marking a significant shift from the earlier indifference and neutrality. These efforts were part of broader socio-economic development plans, recognizing the critical link between population dynamics and national development objectives.
- The evolution of population policies in India reflects a complex interplay of cultural sensitivities, historical legacies, and evolving socio-political contexts. From the early calls for birth control by the intelligentsia to the post-independence emphasis on family planning, India’s approach to population management has been shaped by a recognition of the need for balanced and sustainable growth.
- The population policy in India, aimed at achieving a stable population level conducive to sustainable economic growth, social development, and environmental protection, has been an integral part of the country’s Five-Year Plans.
Population Policy Under Each Five-Year Plan:
| Five-Year Plan | Period | Key Features of Population Policy |
| First Five-Year Plan | 1951-56 | Initiation of the population control program, marking India as the first country in the world to do so in 1952.
Focus on natural family planning methods. |
| Second Five-Year Plan | 1956-61 | Emphasis on education and research regarding population control.
Encouragement of the clinical approach to family planning. |
| Third Five-Year Plan | 1961-66 | Adoption of sterilization techniques for both men and women in 1965.
Introduction of the copper-T technique. Establishment of Family Planning as an independent department. |
| Fourth Five-Year Plan | 1969-74 | Encouragement of all birth control methods, both conventional and modern. |
| Fifth Five-Year Plan | 1974-78 | Announcement of the National Population Policy on 16th April 1976.
Increase in the minimum age for marriage for boys from 18 to 21 years and for girls from 14 to 18 years, as per the Sharda Act of 1929. Permission for forced sterilization, which was later abandoned. Renaming of the Family Planning Department to the Family Welfare Department by the Janata Party government in 1977. |
| 6th, 7th, and 8th Plans | Varied | Implementation of efforts to control the population by setting long-term demographic goals. |
| Ninth Five-Year Plan | Review in 1999 | Drafting of a National Population Policy by the M.S. Swaminathan committee.
Reviewed by the Family Welfare Department in 1999 and passed by Parliament in 2000. |
National Population Policy of India (2000)
The National Population Policy (NPP) of India, formulated in February 2000, represents a strategic approach by the central government to address the challenges posed by the country’s rapidly growing population. The policy delineates a comprehensive framework aimed at achieving sustainable population growth through a series of objectives segmented into temporary, middle-term, and long-term goals.
Objectives of the National Population Policy 2000
- Temporary Objective:
- Ensure the easy supply of birth control devices.
- Develop a health protection framework.
- Recruit health workers to support the policy’s implementation.
- Middle-term Objective:
Aim to reduce the Total Fertility Rate (TFR) to the replacement level of 2.1 by 2010.
Long-term Objective:
Achieve population stabilization by 2045, ensuring that the population level is harmonious with economic, social development, and environmental protection.
Major Objectives Highlighted in the Policy
- Reduce the total fertility rate to 2.1.
- Make birth control services publicly available to encourage a two-child policy.
- Decrease the infant mortality rate (IMR) to 30%.
- Reduce the maternal mortality rate (MMR) to below 100 per 100,000 live births.
- Encourage the late marriage of girls to address early pregnancies and related health risks.
Population Education in India
Population education in India aims to address one of the state’s most formidable challenges: its rapidly increasing population, which undermines development efforts. The initiative seeks to impart factual knowledge about population dynamics, enabling younger generations to understand and mitigate the burden imposed by rapid population growth.
Objectives of Population Education
- Educate students about controlling family size.
- Highlight how population limitation can enhance the nation’s quality of life.
- Demonstrate that a smaller family size can improve living standards for individual families.
- Encourage students to understand the importance of health and welfare in family planning.
- Provide accurate information on the impact of family size and national population changes on individuals.
Measures to Achieve Population Education Objectives
- Utilize education as a motivational force to control overpopulation.
- Engage community forums and voluntary organizations in discussions about family size.
- Integrate lessons on the merits of small families and reproductive biology into school curricula.
- Involve parent-teacher associations in family education efforts.
- Collaborate with other agencies to educate the masses on the benefits of small families.
Government Programs for Population Education
- Recognizing education’s potential to address population growth challenges, the Ministry launched a Population Education Programme in 1980. This program, designed for a five-year duration, aims to introduce population education into the formal education system, creating awareness among the younger generation about population problems and their national responsibilities. Supported by the Government of India, NCERT, and UNESCO, this program targets 143 million school children across primary, secondary, and higher secondary levels.
- India’s National Population Policy and its focus on population education reflect a comprehensive approach to managing the country’s demographic challenges. By targeting various aspects of population dynamics, including fertility rates, health care, and education, the policy aims to achieve sustainable population growth that aligns with the nation’s development goals. However, the effectiveness of these initiatives depends on their implementation and the collective efforts of the government, communities, and individuals to address the complex factors influencing population growth.
Human Settlements
Human settlements represent the diverse ways in which humans inhabit and organize their living spaces, ranging from solitary dwellings to sprawling urban centers. These settlements are not only places of residence but also reflect the interaction between human societies and their environments, incorporating economic, cultural, and social dimensions.
Types of Settlements
Settlements are primarily categorized into two types: rural and urban, each distinguished by its predominant economic activities, population density, and lifestyle.
- Rural Areas: Characterized by lower population density and dominated by primary activities such as agriculture, fishing, and forestry. Rural settlements are closely connected to the land and are often spread out, with inhabitants living in villages or hamlets.
- Urban Areas: Defined by higher population density and the predominance of secondary (manufacturing) and tertiary (services) activities. Urban settlements include towns and cities where living spaces are more compact.
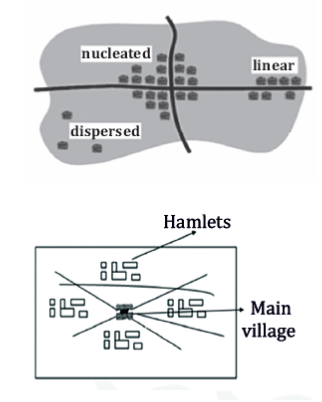
Types of Rural Settlements in India
- Clustered Settlements: These are compact groups of houses with little space between them, often found in fertile agricultural regions. The settlement’s layout may follow a geometric pattern, reflecting a sense of community and shared resources.
- Semi-Clustered Settlements: Arising either from the fragmentation of large villages or the clustering within dispersed settlements, these exhibit a mix of clustered and scattered houses.
- Hamleted Settlements: Characterized by small clusters of houses known locally by different names (e.g., Panna, Para, Palli), often resulting from the segmentation of larger villages due to social or ethnic factors.
- Dispersed Settlements: Consist of isolated dwellings spread out across an area, typical of hilly or mountainous regions where agriculture is not the primary activity.
Factors Influencing Rural Settlements
- Land: Fertility and suitability for agriculture are crucial, with fertile plains being highly populated.
- Water Supply: Proximity to water sources is essential for domestic and agricultural purposes.
- Defence: Historically, settlements were located in defensible positions during times of conflict.
- Ethnic and Cultural Factors: Social structures and community relationships can dictate settlement patterns.
- Building Materials: The availability of local materials influences the construction of homes.
Problems Facing Rural Settlements
- Water Supply and Sanitation: Access to clean water and proper sanitation facilities remains inadequate.
- Natural Hazards: Vulnerability to floods, droughts, and other disasters affects agriculture and living conditions.
- Housing Quality: Many dwellings are made from perishable materials and lack proper ventilation.
- Infrastructure: Poor physical connectivity and inadequate social infrastructure (health, education) hinder development.
Solutions and Development Strategies
- Developing and improving water supply and sanitation facilities.
- Strengthening rural infrastructure (roads, communication networks) to improve connectivity.
- Enhancing disaster preparedness and resilience of agricultural practices.
- Providing access to quality health and education services.
Rural settlements are integral to the fabric of human geography, reflecting the interaction between humans and their environment. Understanding and addressing the challenges they face is crucial for sustainable development and improving the quality of life for rural populations.
Patterns of Rural Settlements and Their Challenges
- Rural settlements exhibit diverse patterns based on geographical, historical, and cultural factors. Understanding these patterns is crucial for planning and development, as each presents unique advantages and challenges.
Patterns of Rural Settlements
- Linear Pattern:
- Description: Settlements develop along linear features such as roads, railways, rivers, canals, or the edges of valleys and levees.
- Advantages: Facilitates easy access to transportation and communication channels, promoting trade and interaction.
- Challenges: May be prone to congestion and limited expansion due to geographical constraints.
Rectangular Pattern:
- Description: Characterized by settlements with a grid-like road network, resulting in rectangular plots and properties.
- Location: Common in plain areas or wide valleys where land division is straightforward.
- Advantages: Organized layout facilitates efficient land use and easy navigation.
- Challenges: Requires careful planning to avoid monotony and ensure adequate public spaces.
Circular Pattern:
- Description: Villages develop in circles around central features like lakes, tanks, or to enclose communal grazing lands.
- Advantages: Enhances community cohesion and provides a central area for communal activities.
- Challenges: Central areas may become neglected or overused without proper management.
Star-like Pattern:
- Description: Emerges where several roads converge, with settlements expanding along these roads from a central point.
- Advantages: Promotes trade and accessibility from various directions.
- Challenges: Can lead to traffic congestion and requires careful planning for expansion.
T-shaped, Y-shaped, Cross-shaped, or Cruciform Settlements:
- Description: Develop at road junctions, with houses extending in the direction of the roads.
- Advantages: Offers potential for growth and easy access to multiple areas.
- Challenges: Intersection areas may need special attention for traffic management and public spaces.
- Double Village:
- Description: Settlements extend on both sides of a river, usually connected by a bridge or ferry.
- Advantages: Facilitates access to water resources and connectivity between the two sides.
- Challenges: Vulnerable to flooding and requires infrastructure maintenance.
Challenges Facing Rural Settlements
Water Supply and Sanitation:
- Issue: Inadequate access to clean water and sanitation facilities leads to water-borne diseases.
- Solution: Development of local water infrastructure and sanitation facilities.
- Natural Hazards:
- Issue: Vulnerability to droughts and floods affects agriculture and living conditions.
- Solution: Implementation of irrigation projects and flood management systems.
Housing Quality:
- Issue: Many homes are built with perishable materials and lack proper ventilation.
- Solution: Promotion of durable building materials and designs that consider local climate and resources.
Physical Connectivity:
- Issue: Poor road conditions and lack of communication networks isolate settlements.
- Solution: Investment in road infrastructure and telecommunications.
- Social Infrastructure:
- Issue: Limited access to health and education services affects quality of life.
- Solution: Development of local schools and healthcare facilities, possibly using mobile units for remote areas.
UPSC PREVIOUS YEAR QUESTIONS
1. As per the UN-Habitat’s Global Report on Human Settlements 2009, which one among the following regions has shown the fastest growth rate of urbanization in the last three decades? (2010)
(a) Asia
(b) Europe
(c) Latin America and Caribbean
(d) North America
2. Consider the following statement: (2021)
1. ‘Right to the City’ is an agreed human right and the UN-Habitat monitors the commitments made by each country in this regard.
2. ‘Right to the City’ gives every occupant of the city the right to reclaim public spaces and public participation in the city.
3. ‘Right to the City’ means that the State cannot deny any public service or facility to the unauthorized colonies in the city.
Which of the statements given above is/are correct?
(a) 1 only (b) 3 only
(c) 1 and 3 (d) 2 and 3
3. Which one of the following best defines the term State? (2021)
(a) A community of persons permanently occupying a definite territory independent of external control and possessing an organized government
(b) A politically organized people of a definite territory and possessing an authority to govern them, maintain law and order, protect their natural rights and safeguard their means of sustenance
(c) A number of persons who have been living in a definite territory for a very long time with their own culture, tradition and government
(d) A society permanently living in a definite territory with a central authority, an executive responsible to the central authority and an independent judiciary.