
OCEANOGRAPHY
Introduction
Oceanography is an interdisciplinary science that explores the Earth’s oceanic and marine systems. It encompasses various branches, including:
- Physical Oceanography: Studies ocean currents, waves, and tides.
- Chemical Oceanography: Focuses on the composition and properties of seawater.
- Biological Oceanography: Examines marine organisms and ecosystems.
- Geological Oceanography: Investigates the ocean floor, including its structure and processes.
Water Distribution on the Surface of Earth
The distribution of water on Earth is critical to understanding the planet’s climate, ecosystems, and human survival. Here’s a detailed table showcasing the distribution of Earth’s water:
| Reservoir | Total Percentage (%) |
| Oceans | 97.25 |
| Ice Caps and Glaciers | 2.05 |
| Lakes | 0.01 |
| Groundwater | 0.68 |
| Soil Moisture | 0.005 |
| Atmosphere | 0.001 |
| Streams and Rivers | 0.0001 |
| Biosphere | 0.00004 |
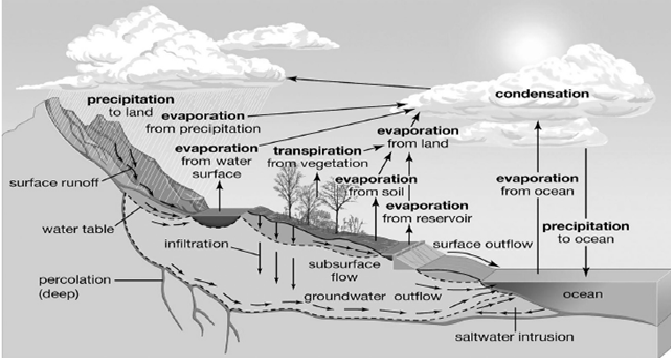
The Hydrological Cycle
The hydrological cycle, also known as the water cycle, is a continuous process by which water circulates throughout the Earth and its atmosphere. Here we break down its components and processes in a structured format:
Components and Processes
1. Water Storage
- Processes: Evaporation, Transpiration, Sublimation
2. Water in Atmosphere
- Processes: Condensation, Precipitation
3. Water Storage in Ice and Snow
- Processes: Melting of snow to streams
4. Surface Runoff
- Processes: Streamflow to freshwater storage
5. Groundwater Storage
- Processes: Groundwater discharge in spring season
Detailed Explanation of Hydrological Cycle Steps
- Evaporation: The transformation of water from liquid to vapor, mainly from the ocean surface.
- Transpiration: The release of water vapor from plants and soil into the atmosphere.
- Sublimation: The direct transition of water from solid (ice or snow) to vapor, skipping the liquid phase.
- Condensation: Water vapor in the air cools and changes back into liquid, forming clouds.
- Precipitation: Water released from clouds in the form of rain, snow, sleet, or hail.
- Melting: Snow and ice melt into water, contributing to streams and rivers.
- Streamflow: Water that flows in streams and rivers, eventually returning to the oceans.
- Groundwater Discharge: Water that infiltrates the ground and is stored in aquifers can be discharged back to the surface in springs or contribute to rivers and lakes.
Understanding these cycles and distributions is vital for managing water resources, predicting weather patterns, and studying climate change impacts on Earth’s water systems.
Important Process in Hydrological Cycle
The hydrological cycle, also known as the water cycle, is a continuous process by which water circulates through the Earth’s hydrosphere. It involves several key processes that play crucial roles in the distribution and movement of water within the Earth’s ecosystem.
1.Evaporation
Evaporation is the process by which water changes from its liquid form to a gaseous form, known as water vapor. This occurs when water from oceans, rivers, lakes, and other bodies of water absorbs heat energy from the sun. As the water molecules gain energy, their movement increases, allowing some to escape into the air as gas. Evaporation is a primary mechanism for transferring moisture into the atmosphere and is instrumental in the formation of clouds and precipitation.
2. Transpiration
Transpiration is the process by which water is absorbed by plant roots, moves up through the plants, and is then released as water vapor from the leaves into the atmosphere. This occurs through small openings in the leaves called stomata. Transpiration is a significant component of the water cycle as it contributes to a substantial portion of the atmospheric moisture and plays a vital role in the climate system and water circulation.
3. Sublimation
Sublimation is the direct transformation of water from its solid state (ice or snow) to a gaseous state (vapor) without first becoming liquid. This process occurs under certain conditions of low pressure and temperature. Sublimation is less common than evaporation but is significant in specific environments, such as the polar ice caps and high mountainous regions, contributing to the atmospheric moisture content.
4. Condensation
Condensation is the process by which water vapor in the air is changed into liquid water. This is the opposite of evaporation. Condensation occurs when moist air cools down to its dew point, leading to the formation of water droplets on dust particles in the air. These droplets can accumulate to form clouds and fog. Condensation is crucial for cloud formation and the precipitation process.
5. Precipitation
Precipitation occurs when water droplets or ice crystals in clouds grow large enough to fall to the ground due to gravity. It can come in various forms, including rain, snow, sleet, or hail, depending on the atmospheric conditions. Precipitation is a primary way water returns from the atmosphere to the Earth’s surface, replenishing water in bodies of water and providing essential moisture for terrestrial ecosystems.
6. Runoff
Runoff is the movement of water, usually from precipitation, across the surface of the land, flowing into rivers, lakes, and eventually into the oceans. It can occur naturally from rain or as a result of melting snow and ice. Runoff plays a critical role in transporting water from the land to the oceans, shaping landscapes through erosion and sediment deposition.
7. Snowmelt
Snowmelt refers to the runoff produced when snow and ice melt. This process is particularly important in regions with seasonal snowpacks, as it is a major source of water supply for rivers and reservoirs in the spring and early summer. Snowmelt’s timing and volume can significantly impact water availability, flood risks, and ecosystem health.
8. Percolation
Percolation is the process by which water moves downward through the soil and rock layers, primarily under the force of gravity. This movement is crucial for recharging aquifers, which are underground layers of water-bearing permeable rock or materials from which groundwater can be extracted. Percolation filters the water naturally and plays a vital role in maintaining the quality and availability of freshwater resources.
Together, these processes interlink to form the hydrological cycle, ensuring the continuous movement and distribution of water within the Earth’s environment. This cycle is fundamental to weather and climate patterns, water purification, and the support of life on Earth.
Oceans
Oceans are vast bodies of saltwater that cover approximately 71% of the Earth’s surface, playing a crucial role in the planet’s climate, weather patterns, and biodiversity. The understanding of oceans extends beyond their surface, delving into the complex and varied topography of the ocean floor, which includes a multitude of geological features similar to those found on continents. Here, we explore the major aspects of oceanic environments, their divisions, and the significant relief features of the ocean floor.
Oceans: The Earth’s Great Depressions
The oceans are the great depressions on the Earth’s outer layer, seamlessly merging into one another, unlike continents, which are distinct and separable. This interconnectedness makes precise demarcation challenging. Oceans hold about 97% of Earth’s water, with the remaining percentage locked in glaciers, ice caps, and freshwater sources. The Earth’s oceanic portion is categorized into five major oceans:
- The Pacific Ocean
- The Atlantic Ocean
- The Indian Ocean
- The Southern Ocean
- The Arctic Ocean
Major Relief Features of the Ocean Floor
Beneath the surface, the ocean floor is as varied and complex as the land we live on. It comprises mountains, basins, plateaus, ridges, canyons, and trenches. These features, known as ocean or submarine relief, are crucial for understanding oceanic processes and the Earth’s geological history.
Ocean Floor Division
The ocean floor is broadly divided into four sections, each with distinct characteristics:
- Continental Shelf
- Continental Slope
- Deep Sea Plain
- Oceanic Deep or Trench
Continental Shelf
- Definition: The Continental Shelf is the extended margin of each continent, occupied by relatively shallow seas and gulfs. It represents the ocean’s shallowest part, with an average gradient of 1° or less.
- Characteristics:

- Ends at a steep slope known as the shelf break.
- Width varies based on coastal land nature—narrow shelves near high, coastal mountains and wider shelves adjacent to expansive plains.
- Sediment Coverage: Variable thickness of sediments from rivers, glaciers, wind, and distributed by waves and currents.
- Features submarine canyons reaching the continental slope, resembling gorges on continents.
- Depth typically ranges from 120 to 370 metres, with widths from a few kilometres to over 100 kilometres.
- The variance in width is evident around the globe, such as between the eastern and western coasts of the Indian peninsula.
Importance of Continental Shelves
Continental shelves are of significant ecological and economic importance. They are rich in marine life, supporting diverse ecosystems, and are key areas for fisheries. Additionally, these regions are explored for oil and gas reserves, contributing to the energy resources on a global scale.
Understanding Oceanic Deep or Trenches
Oceanic trenches are the deepest parts of the ocean floor, formed by tectonic activity where one tectonic plate subducts beneath another. These areas are critical for understanding Earth’s seismic activity and offer insights into marine biodiversity at extreme depths.
Continental Shelf
The Continental Shelf around India presents a fascinating study of geographical and geological contrasts, directly influenced by the country’s diverse coastal dynamics and the rivers that flow into the seas. The differences in the width of the continental shelf along India’s eastern and western coasts highlight the interplay between riverine inputs, sediment deposition, and tectonic activities.
Eastern Coast
- Width: Approximately 50 km wide.
- Characteristics: The continental shelf along India’s eastern coast is relatively narrow, especially off the mouths of major rivers such as the Ganga, Mahanadi, Godavari, Krishna, and Cauvery. These areas, typically 30-35 km wide, exhibit narrow shelves due to the significant sediment load these rivers carry and deposit at their deltas. The sedimentation process here is dynamic, with the deposited sediments constantly reshaped and redistributed by ocean currents and waves.
Western Coast
- Width: About 150 km wide.
- Characteristics: The continental shelf along the western coast is significantly wider, especially off the estuaries of the Narmada, Tapi, and Mahi rivers. The broader shelves in these regions can be attributed to the lesser sediment load compared to the eastern rivers, coupled with the geomorphological and tectonic settings that favor wider shelf formation.
Factors Influencing Shelf Width
- Riverine Sedimentation: The volume and nature of sediments carried by rivers significantly affect the width and characteristics of the continental shelves. Rivers with higher sediment loads tend to form narrower shelves due to rapid sediment deposition at their mouths.
- Tectonic Activity: The geological history and tectonic activity of the region play a crucial role in shaping the continental shelf’s width and structure. The Indian subcontinent’s tectonic movements have led to varied shelf widths along its coast.
- Geomorphology: The coastal landforms and underlying geological structures influence the continental shelf’s breadth. Areas with stable coastal plains and gradual offshore slopes tend to have wider shelves.
- Ocean Dynamics: Ocean currents, waves, and tidal patterns affect sediment distribution along the continental shelf, influencing its width and morphology over time.
Significance of India’s Continental Shelves
The continental shelves along India’s coasts are of immense ecological, economic, and strategic importance. They serve as rich fishing grounds, support diverse marine ecosystems, and are potential sites for offshore mineral and hydrocarbon extraction. Understanding the dynamics and characteristics of these shelves is crucial for sustainable management and conservation of marine resources.
| Economic Significance | Example |
| Mineral and Hydrocarbon | Commercial exploitation of metallic and non-metallic minerals, including iron ore and hydrocarbons, occurs on the continental shelf. Examples include the Chilika Lagoon on the East coast of India, Palk Bay in Tamil Nadu, and the Kanyakumari Coast in the Bay of Bengal. |
| The Richest Zone of Fishing | Notable fishing zones include the Grand Banks of Newfoundland, the North Sea, and the Sunda shelf. These areas are rich in marine life, making them prime locations for commercial fishing. |
| Best for Transportation | Some of the world’s greatest seaports, which are critical hubs for global trade and transportation, are located on continental shelves. This list includes Southampton, London, Hong Kong, Singapore, and Rotterdam. |
| Biological Diversity | Continental shelves promote biological diversity due to the shallow waters allowing sunlight to reach the seabed, fostering the growth of planktons. Planktons serve as the foundational food source for many marine species. Additionally, continental shelves often house coral reefs, which are biodiversity hotspots. |
Continental Slope
- Definition: The continental slope is the steep incline between the outer edge of the continental shelf and the deep ocean basin below.
- Characteristics:
- Canyons and Trenches: This region can feature significant geological formations, including canyons and trenches.
- Gradient and Depth: The slope’s gradient varies between 2-5°, with depths ranging from 200 to 3,000 meters.
- Marine Deposits: The steep gradient typically prevents the accumulation of marine deposits. However, sediment can accumulate at the slope’s base, forming the continental rise.
- Marine Life: There is generally less marine life here than on the continental shelf, due to the steeper terrain and deeper waters.
Deep Sea Plain
- Definition: The deep sea plain, or abyssal plain, represents the ocean floor’s extensive, flat regions, lying at great depths.
- Characteristics:
- Geography: These plains are among the smoothest and flattest areas on Earth, lying two or three miles below sea level and covering two-thirds of the ocean floor.
- Sediments: They are covered with fine-grained sediments, such as clay and silt, which include oozes—sediments formed from the remnants of marine organisms—and red clay from volcanic activity or terrestrial sources.
- Depth: The depth of abyssal plains ranges between 3,000 and 6,000 meters.
Oceanic Deeps and Trenches
- Definition: Oceanic deeps and trenches are the deepest parts of the ocean, representing the Earth’s most profound topographical features.
- Characteristics:
- Deeps: Very deep but less extensive depressions compared to trenches.
- Trenches: Long, narrow depressions, with the Mariana Trench being the most notable example, reaching depths of approximately 11,000 meters.
- Location: These features are often found close to continents, especially around the Pacific Ocean, which is home to the majority of the world’s trenches.
Minor Relief Features of Ocean Floor
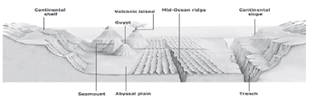
| Feature | Description | Examples |
| Mid-Oceanic Ridges | Composed of two chains of mountains separated by a large depression. Peaks as high as 2500 m and some reach above the ocean’s surface. | Iceland |
| Seamounts | Mountains with pointed summits rising from the seafloor that do not reach the surface of the ocean. Volcanic in origin. High: 3000 – 3500 m. | The Emperor Seamount (Hawaiian Island) |
| Submarine Canyons | Long, narrow, and very deep valleys located on the continental shelves and slopes with vertical walls. Classified on the morphogenesis as glacially eroded and non-glacial. | Hudson Canyon |
| Guyots | Flat-topped seamounts showing evidence of gradual subsidence through stages to become flat-topped submerged mountains. | |
| Atoll | Low islands in tropical oceans consisting of coral reefs surrounding a central depression. Can be part of a lagoon, enclosing a body of water of varying salinity. |
Temperature of Ocean Waters
Understanding the temperature of ocean waters is crucial for comprehending global climate patterns, marine ecosystems, and the overall health of our planet.
Distribution of Ocean Water Temperature
- Tropical Waters: The average surface temperature of tropical waters is around 27°C (80.6°F). These regions receive the most direct sunlight throughout the year, leading to warmer surface temperatures.
- Latitudinal Variation: As one moves from the equator towards the poles, the surface temperature of ocean waters gradually decreases. This decrease is generally quantified as 0.5°C (0.9°F) per degree of latitude. This pattern is due to the curvature of the Earth, which causes solar radiation to spread over a larger area and travel through more of the atmosphere at higher latitudes, reducing the energy received per unit area.
Sources of Ocean Water Temperature
- Surface Water Heating: The primary source of heat for surface water is solar radiation. The Sun heats the surface layer, which then gets diffused to lower depths through the process of convection. This process is more efficient in tropical waters where the Sun’s rays are more direct.
- Bottom Water Heating: Deep ocean waters, particularly those near oceanic ridges, can receive heat from geothermal energy due to volcanic activities. This source of heat is minor compared to solar radiation but is crucial for deep ocean ecosystems.
Measurement of Oceanic Temperature
- Bathythermograph: This instrument is used to measure the temperature at different depths of the ocean. It is a crucial tool for understanding the temperature profile of ocean waters, which can vary significantly with depth.
- Satellites with Microwave Radiometers: These are used to measure the surface temperature of the ocean. Microwave radiometers can penetrate clouds and provide accurate surface temperature data, which is essential for weather forecasting and climate studies.
Physical Principles of Ocean Heating and Cooling
- Slow Process: The heating and cooling of ocean water is a much slower process compared to land. This is due to several factors:
- Sunlight Penetration: Sun rays can penetrate deeper into water than on land, allowing the heat to be distributed over a larger volume.
- Heat Capacity: Water has a high heat capacity, meaning it can absorb a lot of heat before its temperature rises significantly. This property also means that water releases heat more slowly, which has a moderating effect on global climate.
- Energy Diffusion: Water molecules are effective at diffusing energy, which helps distribute heat more evenly throughout the ocean.
The temperature of ocean waters plays a critical role in global weather patterns, marine biodiversity, and the carbon cycle. The distribution and measurement of ocean temperatures help scientists predict weather phenomena like hurricanes and El Niño events, understand climate change, and manage marine resources. This intricate balance of heating and cooling, along with the vastness and depth of the oceans, makes the study of ocean temperatures a complex yet fascinating subject in oceanography and environmental science.
Factor Affecting Temperature Distribution
The distribution of temperature in ocean waters is not uniform and is influenced by various factors that can either raise or lower the temperature in different regions of the world’s oceans. Understanding these factors is essential for comprehending the complexity of marine environments and their influence on global climate patterns.
1.Latitude
- Insolation: The primary factor is the amount of solar radiation (insolation) received, which decreases from the equator towards the poles. This variation is due to the Earth’s curvature, which causes solar rays to strike the equator more directly compared to the oblique angles at higher latitudes, resulting in lower energy absorption and cooler water temperatures poleward.
2. Unequal Distribution of Land and Water
- Hemispherical Differences: The Northern Hemisphere, with its greater landmass, tends to absorb and retain heat more than the Southern Hemisphere, which is predominantly covered by oceans. This difference affects the temperature of adjacent ocean waters; oceans in the Northern Hemisphere are generally warmer due to the proximity to larger landmasses that can store and reradiate heat.
3. Prevailing Winds
- Offshore Winds: Winds blowing from the land towards the ocean (offshore winds) tend to carry away surface heat, reducing water temperature near coastlines.
- Onshore Winds: Conversely, winds blowing from the ocean towards the land (onshore winds) can transport warm air and increase water temperatures near coastlines by piling up warm surface water.
4. Ocean Currents
Ocean currents play a significant role in redistributing heat across the planet’s surface:
- Warm Currents: These currents flow from equatorial regions towards the poles, carrying warm water into colder areas, thereby raising the temperature of those regions. For example, the Gulf Stream carries warm water from the Gulf of Mexico along the eastern coast of North America and across the North Atlantic to Western Europe.
- Cold Currents: Cold currents flow from Polar Regions towards the equator, bringing cold water into warmer areas, which can significantly lower the temperature. The Labrador Current, for instance, carries cold water southward along the northeast coast of North America.
5. Other Minor Factors
Several other elements can also influence ocean water temperature, although their impact might be more localized:
- Submarine Ridges: These can affect ocean currents and, consequently, the temperature distribution by redirecting water flow.
- Local Weather Conditions: Phenomena such as cyclones, hurricanes, and fog can alter surface temperatures temporarily.
- Geographical Features: The location, shape, and size of seas and their longitudinal and latitudinal extensions can influence temperature by affecting water movement and exposure to sunlight.
These factors combined determine the complex patterns of temperature distribution in the world’s oceans. They are crucial for understanding marine life distributions, weather and climate patterns, and even global climate change scenarios.
Horizontal and Vertical Distribution of Temperature
To provide a detailed explanation and in-depth details on the horizontal and vertical distribution of ocean temperatures, we will break down the concept into two main sections: horizontal distribution and vertical distribution. Each section will be elaborated with appropriate formatting for clarity.
Horizontal Distribution of Temperature
The horizontal distribution of ocean temperature refers to how water temperatures vary across different latitudes from the equator towards the poles. This variation can be summarized in the table and points below:
| Latitude Range | Temperature Change | Note |
| Equator | 26.7°C average | Highest due to direct insolation. |
| Towards Poles | Decreases | The rate of decrease is approximately 0.5°F per latitude. |
| Hemisphere Impact | Varied | Northern Hemisphere oceans show higher average temperatures than those in the Southern Hemisphere. |
- Key Points:
- The average surface water temperature at the equator is approximately 26.7°C.
- Temperature decreases as one moves from the equator towards the poles, at an average rate of 0.5°F per latitude.
- Northern Hemisphere oceans have a relatively higher average temperature compared to the Southern Hemisphere.
Vertical Distribution of Temperature
The vertical distribution of temperature in the oceans describes how temperatures change from the surface to deeper waters. This distribution can be detailed as follows:
| Depth Range | Temperature Change | Note |
| Surface | Maximum | Directly receives insolation, making it the warmest layer. |
| Up to 200m | Rapid decrease | The temperature falls rapidly due to reduced sunlight penetration and mixing of water layers. |
| Below 200m | Slow decrease | Beyond 200 meters, the rate of temperature decrease slows down, indicating less influence of surface conditions. |
- Key Points:
- Ocean temperature is always maximum at the surface due to direct solar radiation (insolation).
- The rate of temperature decrease is rapid up to a depth of 200 meters, beyond which the decrease slows down significantly.
- This pattern indicates a strong influence of solar radiation on surface temperatures and a diminishing effect with depth.
Average Annual Temperatures
The average annual temperatures of oceans globally, as well as differentiated by hemisphere, provide insight into the overall thermal characteristics of these vast water bodies:
| Region | Average Annual Temperature |
| All Oceans | 17.2°C |
| Northern Hemisphere Oceans | 19.4°C |
| Southern Hemisphere Oceans | 16.1°C |
- Overview:
- The global average temperature of ocean surfaces is 17.2°C.
- There is a noticeable difference between the hemispheres, with the Northern Hemisphere having warmer oceans on average (19.4°C) compared to the Southern Hemisphere (16.1°C).
This detailed breakdown helps in understanding the complex nature of temperature distribution in the world’s oceans, influenced by factors such as latitude, solar insolation, and oceanic depth.
Thermocline
The concept of a thermocline is pivotal in understanding oceanic and atmospheric dynamics. It plays a critical role in marine ecosystems, weather patterns, and climate dynamics.
Understanding Thermoclines
A thermocline is a distinct layer in a large body of water, such as an ocean or a lake, marking the transition between the warmer, mixed water near the surface and the cooler, denser water below. This layer is significant because it acts as a barrier to the mixing of surface and deep waters, which has profound effects on marine life, weather, and climate patterns.
Role in Meteorological Forecasting
Thermoclines are crucial for meteorological forecasting, particularly in predicting hurricane formation. The depth of warm water above the thermocline, which can be considered as a “fuel tank” for hurricanes, provides essential information. Warm water evaporates more readily, contributing to the water vapor in the air. Since water vapor is a primary fuel for hurricanes, understanding the depth of the thermocline helps forecasters assess the potential for hurricane development.
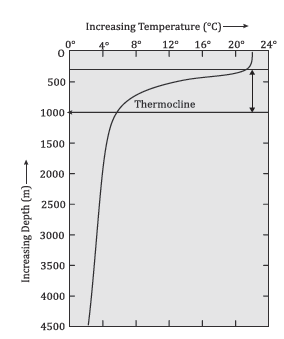
Location of the Main Thermocline
Mesopelagic Zone
The main thermocline is predominantly located within the mesopelagic zone of the ocean, which extends from about 200 meters to 1,000 meters below the ocean surface. This zone is characterized by a significant decrease in temperature with depth. The sharp temperature gradient found in the main thermocline is a defining characteristic of this region, affecting the distribution of marine life and the ocean’s thermal structure.
Absence of Thermocline in Polar Regions
Lack of Permanent Thermocline
In polar regions, a permanent thermocline is typically absent. This absence is due to the minimal temperature difference between the very cold surface waters and the cold deep waters. Polar regions do not have the significant temperature gradient that is necessary to form a stable thermocline, as found in more temperate or tropical waters.
Seasonal Thermocline and Vertical Mixing
Although a permanent thermocline is absent, a seasonal thermocline can form during warmer months. However, this is usually short-lived. The polar regions experience almost constant vertical mixing of their waters throughout the year. This mixing is facilitated by the lack of a strong temperature gradient, winds, and currents, which work together to homogenize the water column’s temperature.
SALINITY OF OCEAN WATER
Salinity is a fundamental aspect of ocean water, playing a critical role in defining the chemical composition, density, and circulation of seawater. It affects marine ecosystems, the global climate, and even weather patterns. Let’s explore the concept of salinity in more detail, along with the composition of seawater as highlighted.
Understanding Salinity
Salinity refers to the total content of dissolved salts in ocean or sea water. It is a measure of the concentration of salts in water and is typically expressed in parts per thousand (ppt) or practical salinity units (PSU). Salinity is a key parameter in oceanography, affecting the density of seawater, which in turn influences ocean currents and climate patterns.
Role in Demarcating Brackish Water
Salinity is also used to differentiate between types of water bodies based on their salt content. Specifically, it helps demarcate the upper limit of brackish water, which is water that has more salinity than freshwater but less than seawater. Brackish water is often found in estuaries where freshwater from rivers meets and mixes with seawater.
Contribution of Volcanic Ash
Volcanic ash can contribute to ocean salinity by adding various minerals and salts to the water when it falls into the ocean. These contributions can temporarily alter the local salinity levels and have implications for marine life and water chemistry.
Composition of Seawater
The salinity of seawater is not just about the presence of sodium chloride (table salt); it encompasses a wide variety of dissolved salts and minerals. The composition of seawater is a result of various processes, including weathering of rocks, volcanic activity, and atmospheric deposition.
| Salts | Percentage |
| Sodium Chloride | 77.8% |
| Magnesium Chloride | 10.9% |
| Magnesium Sulphate | 4.7% |
| Calcium Sulphate | 3.6% |
| Potassium Sulphate | 2.5% |
Sodium Chloride (NaCl)
Sodium chloride is the most abundant salt in seawater, constituting approximately 77.8% of the dissolved salts. It is primarily responsible for the salty taste of seawater.
Magnesium Chloride (MgCl₂)
Making up about 10.9% of seawater’s dissolved salts, magnesium chloride plays a crucial role in the seawater chemical composition and marine organisms’ metabolic processes.
Magnesium Sulphate (MgSO₄)
This salt accounts for approximately 4.7% of seawater’s salinity and is involved in various biochemical cycles in the marine environment.
Calcium Sulphate (CaSO₄)
Calcium sulphate contributes about 3.6% to the seawater’s salinity and is important for the structural integrity of marine organisms, such as corals and shellfish.
Potassium Sulphate (K₂SO₄)
Though less prevalent, potassium sulphate constitutes about 2.5% of the dissolved salts in seawater and is vital for the functioning of marine ecosystems.
Factors Affecting Ocean Salinity:
The salinity of ocean water, a critical parameter in oceanography, is influenced by various environmental factors. These factors play a substantial role in determining the distribution and concentration of salinity across different regions of the ocean. Understanding these influences is essential for comprehending marine ecosystems, global climate patterns, and the ocean’s physical properties.
1. Evaporation
- Direct Relationship with Salinity: There is a positive correlation between evaporation rates and salinity levels. Higher evaporation rates lead to an increased concentration of salts in seawater, thereby raising its salinity.
- Impact of Temperature and Humidity: Evaporation is more pronounced under conditions of high temperature combined with low humidity, which leads to greater salt concentration and higher salinity.
- Variation by Latitude: Tropic regions, which are characterized by high temperatures and dry air, often exhibit higher salinity compared to the equator. This difference is attributed to the higher rate of evaporation in these regions.
- Control of Evaporation by Salinity: Salinity can also regulate evaporation rates, as higher salinity reduces the rate at which water evaporates.
2. Precipitation
- Inverse Relationship with Salinity: Precipitation has an inverse relationship with salinity; areas with high rainfall typically have lower salinity levels due to the dilution of seawater with fresh water.
- Geographical Influences: Equatorial regions, known for their high precipitation rates, generally have lower salinity levels. In contrast, subtropical regions, where rainfall is scarcer, exhibit higher salinity.
- Polar Regions: The melting of ice in polar regions, which increases freshwater flow into the oceans, further reduces salinity in these areas.
3. Influx of River Water
- Dilution Effect: Rivers carry dissolved salts from the land to the ocean but significantly reduce salinity near their mouths by diluting seawater with large volumes of freshwater.
- Seasonal Variations: The impact of river discharge on ocean salinity is seasonal; salinity decreases with the maximum runoff during rainy seasons and increases during dry seasons.
4. Atmospheric Pressure and Winds
- Influence of Atmospheric Pressure: High atmospheric pressure conditions, particularly in anticyclones, can increase surface water salinity by promoting evaporation.
- Role of Winds: Winds significantly influence the redistribution of salt in ocean waters by moving saline water to areas of lesser salinity. The Westerlies, for example, are known to increase salinity on the west coasts of continents and decrease it on the east coasts.
5. Circulation of Oceanic Water
- Warm and Cold Currents: The circulation of oceanic water, through warm and cold currents, affects salinity distribution. Warm equatorial currents tend to reduce salinity on the western coasts and increase it on the eastern coasts of continents. Conversely, cold currents like the Labrador Current decrease salinity along the northeastern coast of North America.
- These factors, through their intricate interplay, contribute to the dynamic and complex pattern of ocean salinity worldwide. Understanding these relationships is crucial for predicting changes in marine environments, weather patterns, and even in addressing climate change implications.
Horizontal Distribution of Salinity
The horizontal distribution of salinity in the world’s oceans, inland seas, and lakes is a complex phenomenon influenced by various factors including temperature, evaporation, precipitation, river influx, and the melting of polar ice.
Latitudinal Distribution of Salinity
Equatorial Regions (0° Latitude)
- Characteristics: These regions experience high temperatures and significant rainfall, which contributes to a lower average salinity level. The constant influx of fresh water from precipitation dilutes the seawater, counteracting the effects of evaporation.
- Salinity Level: Approximately 35%, which is lower than might be expected given the high evaporation rates, due to the heavy rainfall.
Subtropical Zones (20°-40° N/S Latitude)
- Characteristics: This zone is marked by high temperatures and high evaporation rates but receives less rainfall. The lack of fresh water influx and high evaporation rates contribute to higher salinity levels.
- Salinity Level: Around 36%, making it one of the highest salinity levels observed globally. This increased salinity is due to the optimal conditions for salt concentration: high evaporation and low precipitation.
Temperate Zones (40°-60° N/S Latitude)
- Characteristics: These areas experience moderate temperatures and more balanced precipitation, which leads to lower salinity levels compared to the subtropical zones.
- Salinity Level: The salinity drops to about 31% in the Northern Hemisphere and 33% in the Southern Hemisphere, influenced by the increased precipitation and lower evaporation rates compared to the subtropics.
Polar Regions
- Characteristics: The polar regions are characterized by very low temperatures, which limit evaporation. Moreover, the influx of freshwater from melting ice further reduces salinity.
- Salinity Level: Salinity decreases significantly at the poles due to the diluting effect of melting ice.
Inland Seas
Characteristics
- Geological Setting: Inland seas are often found in tectonically stable areas, meaning they experience little to no earthquake activity. They are surrounded partially or completely by continental crust.
- Sedimentation: These basins are filled with thick layers of clastic sediments, and formations of mud and salt diapirs are common.
- Examples and Variability: The Caspian and Black Seas, remnants of ancient oceans, and the Gulf of Mexico are prime examples. The crustal thickness and layer distributions in these basins can vary significantly, from 15 km in the Gulf of Mexico to 45 km in the Caspian Sea.
Salinity
- Inland seas can have varied salinity levels, often higher than open oceans due to limited exchange with the open sea, high evaporation rates, and in some cases, the influx of saline groundwater.
Inland Lakes
Characteristics
- Water Source: The primary source of water for inland lakes is groundwater, which seeps up from beneath the Earth’s surface, filling these natural basins.
- Ecosystem Services: Inland lakes are crucial for biodiversity, serving as habitats for various species of fish, underwater vegetation, and wildlife. They are also essential for human activities, providing sources of fresh drinking water and opportunities for recreation, which support local economies.
Salinity
- The salinity of inland lakes varies widely, from fresh bodies of water with minimal salt content to hypersaline lakes like the Dead Sea, where high evaporation rates and low freshwater influx concentrate salts.
| Term | Definition | Depth Range | Associated Changes |
| Isohaline | Lines that join places of equal salinity at the sea surface. | Surface level | Spatial distribution of surface salinity. |
| Thermocline Zone | The layer of ocean between the depth zones of 300 – 1000 meters characterized by a sharp change of temperature in the vertical section of the sea water. | 300 – 1000 meters | Sharp temperature gradient. |
| Halocline | A zone of sharp salinity changes in the vertical section of the ocean, often coinciding with the thermocline zone. | 300 – 1000 meters | Sharp salinity gradient. |
Salinity of Marginal Seas
| Water Body | Location | Salinity Value | Factors Affecting Salinity |
| The North Sea | Higher latitudes | Not specified | Higher salinity due to the North Atlantic Drift bringing more saline water. |
| The Baltic Sea | 7 ppt | Low salinity due to the large influx of river water. | |
| The Mediterranean Sea | Not specified | High salinity due to high evaporation rates. | |
| The Black Sea | Not specified | Low salinity due to the large influx of river water. | |
| Lake Van | Antarctica | 330 ppt | Extremely high salinity of 35%. |
| Dead Sea | Between Jordan and Israel | 280 ppt | Extremely high salinity, about eight times saltier than average seawater (35 ppt). |
| Red Sea | 42 ppt | ||
| Caspian Sea | 180 ppt |
Importance of Salinity in Ocean life
Salinity, the concentration of dissolved salts in water, plays a crucial role in oceanic environments, affecting both physical processes and marine life. This importance can be explored in depth by examining its effects on seawater density, ocean circulation, the Earth’s water cycle, and marine organisms.
Seawater Density and Ocean Circulation
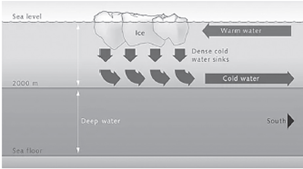
Salinity, along with temperature, determines the density of seawater. Water with higher salinity is denser than less saline water. This variation in density is a driving force behind the thermohaline circulation, a global conveyor belt that moves water masses through the world’s oceans.
- Thermohaline Circulation: This process involves the sinking of cold, salty water in the polar regions and its flow toward the equator, where it is gradually warmed and rises to the surface. This circulation is essential for distributing heat around the planet, thereby regulating the climate and ensuring that the polar regions are not excessively cold while the equatorial regions are not excessively warm.
- Climate Regulation: The movement of heat by ocean currents significantly affects weather patterns and climate systems. For instance, the Gulf Stream carries warm water from the Gulf of Mexico across the Atlantic to Europe, contributing to milder winter temperatures in Western Europe than would otherwise be expected at those latitudes.
Earth’s Water Cycle
Salinity is intimately linked to the global water cycle, which encompasses the movement of water in its various states (vapor, liquid, and ice) through the atmosphere, land, and oceans.
- Evaporation and Precipitation: Areas of high salinity often indicate regions where evaporation exceeds precipitation, such as in subtropical gyres. Conversely, low salinity areas can signify regions with significant freshwater input from rivers, precipitation, or melting ice. Monitoring salinity helps scientists understand the intricate details of the water cycle, including how freshwater is distributed and how these patterns may be changing due to climate change.
Impact on Marine Life
Marine organisms are adapted to specific ranges of salinity, and significant deviations can be harmful or even fatal.
- Osmoregulation: Fish and other marine life regulate the concentration of salts in their bodies through a process called osmoregulation. This balance is crucial for their survival, as too much or too little salt can disrupt their biological functions.
- Environmental Stress: Changes in salinity can cause stress to marine organisms. For example, if the salinity of the water decreases significantly, water may flow into the cells of marine organisms in an attempt to dilute the internal salt concentration. This can lead to swelling and, potentially, death. Conversely, in highly saline environments, organisms may struggle to maintain hydration, leading to dehydration and other physiological stresses.
- Ecosystem Diversity and Productivity: Salinity levels influence the types of species that can live in certain areas of the ocean. Ecosystems such as estuaries, where freshwater mixes with seawater, have unique species adapted to the varying salinity levels. Changes in salinity can alter these ecosystems, affecting biodiversity and productivity.
Caspian Sea Bordering Countries
| Sr. | Country | Capital | Trick |
| 1 | Turkmenistan | Ashgabat | T |
| 2 | Azerbaijan | Baku | A |
| 3 | Russia | Moscow | R |
| 4 | Iran | Tehran | I |
| 5 | Kazakhstan | Nur-Sultan | K |
Black Sea Bordering Countries
| Sr. | Country | Capital | Trick |
| 1 | Turkey | Ankara | Turkish |
| 2 | Bulgaria | Sofia | B |
| 3 | Ukraine | Kiev | U |
| 4 | Russia | Moscow | R |
| 5 | Georgia | Tbilisi | Ge |
| 6 | Romania | Bucharest | R |
Red Sea Surrounding Countries
| Sr. | Country | Capital | Trick |
| 1 | Djibouti | Djibouti | D |
| 2 | Eritrea | Asmara | E |
| 3 | Saudi Arabia | Riyadh | S |
| 4 | Sudan | Khartoum | S |
| 5 | Egypt | Cairo | E |
| 6 | Yemen | Sana’a | Y |
North Sea Bordering Countries
| Sr. | Country | Capital | Trick |
| 1 | Denmark | Copenhagen | D |
| 2 | England | London | E |
| 3 | Netherlands | Amsterdam | N |
| 4 | Germany | Berlin | G |
| 5 | France | Paris | F |
| 6 | Belgium | Brussels | B |
| 7 | Scotland | Edinburgh | S |
| 8 | Norway | Oslo | N |
Baltic Sea Bordering Countries
| Sr. | Country | Capital | Trick |
| 1 | Russia | Moscow | Ru |
| 2 | Denmark | Copenhagen | De |
| 3 | Germany | Berlin | Germany |
| 4 | Sweden | Stockholm | S |
| 5 | Estonia | Tallinn | E |
| 6 | Latvia | Riga | L |
| 7 | Lithuania | Vilnius | L |
| 8 | Poland | Warsaw | Poland |
| 9 | Finland | Helsinki | Finland |
Adriatic Sea Bordering Countries
| Sr. | Country | Capital | Trick |
| 1 | Montenegro | Podgorica | M |
| 2 | Bosnia | Sarajevo | B |
| 3 | Albania | Tirana | A |
| 4 | Italy | Rome | I |
| 5 | Croatia | Zagreb | C |
| 6 | Slovenia | Ljubljana | S |
Density of Ocean Water
The density of ocean water is a fundamental property that has significant implications for ocean circulation, climate, and marine life. To understand this concept in depth, let’s break it down into detailed sections:
1.Definition of Density
Density is a measure of how much mass is contained in a given volume of a substance. It is typically expressed in grams per cubic centimeter (g/cm³). The formula to calculate density (ρ) is given by:
ρ=V/m
where m is mass in grams, and V is volume in cubic centimeters.
2. Relation to Specific Gravity
Specific gravity is a dimensionless quantity that represents the ratio of the density of a substance to the density of a reference substance at a specified temperature and pressure, typically distilled water. Mathematically, specific gravity (SG) can be expressed as:
SG=ρwater/ρsubstance
This comparison helps in understanding how heavy or light a substance is relative to water.
3. Density of Pure Water
At 4 degrees Celsius (39.2 degrees Fahrenheit), pure water achieves its maximum density of approximately 1 gram per cubic centimeter (1 g/cm³). This temperature is significant because water is at its densest at this point, and it expands upon either cooling down below 4°C or warming up above 4°C due to the anomalous expansion of water.
4. Density of Seawater
The density of seawater is more complex because it is influenced by three main factors: temperature, pressure, and salinity.
- Temperature: Like pure water, the density of seawater decreases as the temperature increases but also decreases below 4°C due to the presence of salts.
- Pressure: Increasing pressure tends to increase the density of seawater by compressing it, although the effect is less significant than temperature or salinity.
- Salinity: Salinity, or the concentration of dissolved salts in water, significantly affects the density of seawater. Higher salinity increases the density of seawater. The average salinity of the ocean’s surface water is about 35 parts per thousand (ppt), but it can vary regionally.
5. Effects of Salinity on Freezing Point and Density
Salinity not only increases the density of seawater but also lowers its freezing point compared to fresh water. The more saline the water, the lower its freezing point. This is why oceans remain liquid at temperatures where freshwater bodies might freeze. Additionally, the temperature of maximum density for seawater is depressed as salinity increases, moving below the 4°C mark that is characteristic of pure water.
6. Implications
The density of seawater plays a crucial role in oceanic circulation patterns, including the thermohaline circulation, which helps distribute heat around the planet and influences climate systems. Variations in salinity and temperature, and thus density, drive the movement of ocean currents, affecting weather patterns, marine ecosystems, and global climate.
Understanding the density of ocean water is essential for various scientific disciplines, including oceanography, climatology, and marine biology, as it influences ocean circulation, marine life distribution, and climate patterns across the globe.
Distribution of Density
The distribution of ocean water density is a dynamic and complex process influenced by various factors such as temperature, salinity, and the movement of water masses across different latitudes. This distribution has profound effects on ocean circulation, climate, and marine ecosystems. Let’s explore how density distribution varies and its implications:
Latitudinal Variation in Density
- Equator to Poles: As water moves from the equator towards the poles, it undergoes significant changes in temperature and salinity, which affect its density. In tropical regions, high temperatures result in lower water density. However, as water moves towards the poles, it cools down, and its density increases. This is because cooler water contracts, becoming denser. Additionally, polar waters tend to have higher salinity levels due to the formation of sea ice, which leaves salt behind in the surrounding water, further increasing its density.
- Upper Layer Density: The density of the upper layer of the ocean generally increases from the tropics to the poles. This increase in density is primarily due to the decrease in temperature and variations in salinity as water moves poleward. The colder temperatures and higher salinity levels at higher latitudes make the water denser.
Convergence and Divergence of Water Masses
- Collision of Water Masses: When two water masses with differing densities meet, the denser water tends to sink below the less dense water. This process is a fundamental aspect of oceanic thermohaline circulation, where denser, colder, and saltier water sinks and flows beneath lighter, warmer, and fresher water.
- Distribution After Sinking: After the denser water sinks, it spreads out horizontally at a depth where its density matches that of the surrounding water. This process can lead to the formation of deep ocean currents that transport water, heat, and nutrients across vast distances.
- Latitudinal Differences in Sinking: In the middle latitudes, denser water tends to sink at lower depths compared to water at higher latitudes. This is because the density differences between water masses are more pronounced at higher latitudes due to the extreme cold and higher salinity levels. As a result, water that sinks at higher latitudes does so from a relatively shallower depth but can spread over a large area at the bottom of the ocean.
Implications of Density Distribution
The varying distribution of density across latitudes and depths plays a crucial role in the global ocean circulation system. This system, often referred to as the “global conveyor belt,” is critical for regulating the Earth’s climate by redistributing heat from the equator towards the poles. It also affects marine life by influencing the distribution of nutrients and oxygen in the ocean depths. Understanding the dynamics of density distribution is essential for predicting changes in ocean circulation patterns, which can have significant impacts on global climate trends and marine ecosystems.
Vertical Distribution of Density
The vertical distribution of density in the ocean is a critical aspect of oceanic circulation and stratification. It plays a significant role in shaping water movement, nutrient distribution, and the overall structure of the ocean.
1.Surface to Bottom Density Gradient
- Surface Density: The surface layer of the ocean typically exhibits lower density compared to deeper layers. This is primarily due to factors such as warmer temperatures, lower salinity (especially in regions where freshwater input from rivers or melting ice occurs), and wind-driven mixing.
- Increasing Density with Depth: As one moves deeper into the ocean, the density generally increases. This increase is attributed to factors such as decreasing temperature and increasing salinity with depth. Colder water is denser than warmer water, and water at greater depths tends to have higher salinity due to processes like evaporation and mixing with deeper, more saline water masses.
2. Vertical Mixing and Stratification
- Sinking of Less Dense Water: When less dense water encounters denser water, it tends to sink beneath the denser layer until it reaches a depth where the water’s density matches its surroundings. This process, known as vertical mixing or overturning, helps redistribute heat, nutrients, and dissolved gases within the ocean.
- Formation of Bottom Water: At convergence points where water masses of differing densities meet, denser water sinks to the bottom, forming bottom water. This bottom water tends to be colder and denser than the water above it.
- Counter-Currents: In some regions, such as the ocean’s interior, there are counter-currents that flow opposite to surface currents. These deep currents, driven by density differences rather than wind, transport dense water masses along the ocean floor, often from high to low latitudes.
3. Factors Influencing Density
- Salinity: The concentration of dissolved salts in seawater affects its density. Higher salinity increases water density, while lower salinity decreases it.
- Temperature: Temperature variations play a crucial role in density distribution. Colder water is denser than warmer water. Thus, as water cools with depth, its density generally increases.
- Depth: Pressure increases with depth in the ocean, compressing seawater and increasing its density. However, depth-related density changes are often secondary to temperature and salinity effects.
 Understanding the vertical distribution of density is essential for comprehending oceanic circulation patterns, vertical mixing processes, and the transport of heat and nutrients within the ocean. It also has implications for climate modeling, marine biology, and ocean resource management.
Movement of Ocean Water
The movement of ocean water is an intricate and dynamic process, influenced by a variety of factors and resulting in phenomena that play crucial roles in climate regulation, nutrient cycling, and marine biodiversity.
Ocean Water Composition
- Basic Composition: Ocean water is not just H2O; it’s a complex solution that consists of about 96.5% water and 2.5% salts, with the remainder being a mix of dissolved organic and inorganic materials, particulates, and atmospheric gases.
- Salts and Minerals: The salinity, or salt content, of ocean water is a critical factor influencing its density and freezing point. Common salts include sodium chloride, magnesium sulfate, and calcium carbonate.
- Dissolved Gases: Oxygen, carbon dioxide, and nitrogen are among the gases dissolved in ocean water, which are essential for marine life and play roles in various biogeochemical cycles.
Movement of Ocean Water
Ocean water moves in two primary directions, influenced by a multitude of factors:
1.Horizontal Movement (Currents)
- Surface Currents: Driven mainly by wind patterns, these currents can be warm or cold, influencing climate by transferring heat across the Earth’s surface.
- Gyres: Large-scale circular current systems formed by the Coriolis effect, they help distribute thermal energy and influence weather patterns.
- Deep Ocean Currents: Driven by differences in water density, caused by variations in temperature and salinity, these currents circulate water globally in what is known as the thermohaline circulation.
2. Vertical Movement (Upwelling and Downwelling)
- Upwelling: Occurs when deep, colder, and nutrient-rich water rises to the surface, often supporting high levels of productivity and biodiversity.
- Downwelling: Involves surface waters moving downward, transporting oxygen and other surface materials into the deep ocean.
Influencing Factors
The movement of ocean water is influenced by a myriad of factors, each interplaying to shape the oceans’ dynamics:
- Temperature and Salinity: Affect water density, with colder, saltier water being denser and sinking, driving thermohaline circulation.
- Wind: Surface winds drive currents and waves, influencing weather and climate patterns.
- Earth’s Rotation and the Coriolis Effect: Influence the direction of ocean currents and wind patterns.
- Ocean Topography: The shape and features of the ocean floor affect current directions and speeds.
- Solar Radiation: Affects temperature, driving evaporation and precipitation cycles.
- Tides: Caused by gravitational interactions with the Moon and the Sun, tides affect coastal processes and marine life habitats.
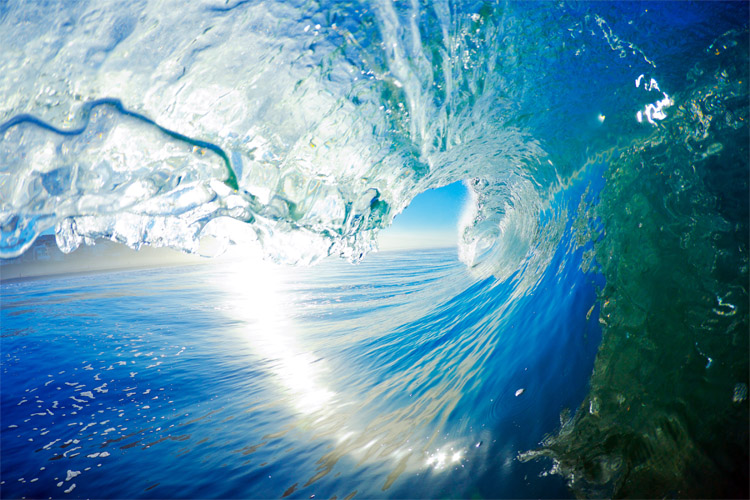
Waves
- Formation and Energy: Waves are formed by wind transferring energy to the water surface. The size and energy of a wave depend on the wind speed, duration, and the distance over which it blows (fetch).
- Motion: As waves travel, the water particles move in orbital patterns, with minimal actual forward movement of water.
- Impact on Shorelines: Waves play a critical role in shaping coastlines, eroding rock, and depositing sediment.
- Wave Types: Their characteristics vary widely, from small ripples to large swells, with some waves traveling vast distances across ocean basins.
Waves are a fundamental aspect of oceanography, embodying the dynamic interaction between the atmosphere and the ocean. They are not just a surface phenomenon but are a critical part of the energy transfer processes within the Earth’s system.

Understanding Waves: The Ocean’s Energy in Motion
The Nature of Waves
- Definition and Movement: Waves represent energy traveling across the ocean’s surface. Contrary to what might be visually apparent, water particles within waves move in small circles, not progressing much horizontally but oscillating with the energy passing through them. This motion is confined mostly to the surface, leaving the deep ocean waters largely unaffected.
Source of Energy
- Wind as the Primary Driver: The primary source of energy for waves is the wind. Wind energy is transferred to the water, creating waves that traverse the ocean’s expanse. This interaction begins with the friction between the air molecules and the water surface, imparting kinetic energy to the water and initiating wave motion.
Dynamics and Impact
- Interaction with the Shoreline: As waves approach the shoreline, their speed decreases due to the friction between the moving water and the sea floor. This slowing down is more pronounced as the water depth decreases near the beach, leading to the breaking of waves and the release of energy along the coastlines.
- Behavior in Open Ocean vs. Near Shore: In the open ocean, waves can achieve significant sizes, growing larger as they capture more wind energy. This growth continues until energy loss mechanisms, such as breaking or spreading, balance the energy input from the wind. Near the shore, the interaction with the sea bottom shapes the waves, causing them to rise, steepen, and eventually break.
Wave Propagation and Characteristics
- Mechanism of Travel: Waves travel across the ocean’s surface as the wind pushes the water along its course. The gravitational pull of the Earth acts on the wave crests, pulling them downwards, which together with the wind’s push, creates the wave motion. This interplay of forces results in the wave’s forward movement and its characteristic shape.
- Determinants of Size and Shape: The size and shape of a wave provide clues to its origin. Waves with steep profiles are typically young, generated by local winds, and have not traveled far from their source. In contrast, long, slow, and steady waves have traveled great distances, possibly originating from storms in another hemisphere. These differences reflect the energy input and the wave’s journey across the ocean.
Characteristics of the Waves
| Characteristic | Description |
| Wave crest and trough | The highest and lowest points of a wave are called the crest and trough respectively. |
| Wave height | It is the vertical distance from the bottom of a trough to the top of a crest of a wave. |
| Wave amplitude | It is one-half of the wave height. |
| Wave period | It is merely the time interval between two successive wave crests or troughs as they pass a fixed point. |
| Wavelength | It is the horizontal distance between two successive crests. |
| Wave speed | It is the rate at which the wave moves through the water, and is measured in knots. |
| Wave frequency | It is the number of waves passing a given point during a one second time interval. |
Factors Influencing Ocean Waves
Wind Characteristics
1.Primary Driver: The movement of wind across the water surface is the primary cause of wave generation. The interaction between wind and water transfers energy from the air to the sea, initiating wave formation.
2. Impact on Wave Characteristics:
-
- Speed of Wind: The velocity at which the wind blows over the water surface directly influences the height, shape, and speed of the waves. Generally, higher wind speeds result in larger waves.
- Duration: The length of time the wind blows over a particular area of the ocean also affects wave development. Longer wind durations allow more energy transfer, producing larger waves.
- Fetch: This refers to the uninterrupted distance over the water that the wind blows. A longer fetch can generate larger waves, as the wind has more time to transfer energy to the water.
- Wind Direction: The direction in which the wind pushes the water also plays a role in determining where and how the waves will travel and break.
Geological Events
- Beyond wind, several geological phenomena can influence wave height and energy:
- Earthquakes Underwater: Subsea seismic activities can displace water abruptly, generating waves that can grow into tsunamis with devastating energy.
- Volcanic Eruptions: Similar to earthquakes, volcanic eruptions under the sea can create large waves by rapidly displacing water.
- Underwater Landslides: These events can also generate waves by the sudden movement of large volumes of water.
Tsunami Formation
- Destructive Potential: Waves generated by geological events, especially undersea earthquakes, can lead to tsunamis. Unlike wind-generated waves, tsunamis carry immense energy across vast distances at high speeds, becoming fatal as they reach shallow waters and shorelines.
Comprehensive Factors for Wave Formation
- The creation of significant wave formations is contingent upon the interplay of three crucial factors:
- Wind Velocity: Faster wind speeds contribute to the creation of larger waves.
- Fetch: The greater the distance over which the wind blows uninterrupted, the more substantial the waves can become.
- Duration: The longer the wind affects a particular area of the ocean, the more pronounced the wave development.
- These elements collectively determine the energy transferred to the waves and, consequently, their size and power. However, it’s essential to note that if the wind speed is low, it limits the wave size regardless of the fetch or duration of the wind.
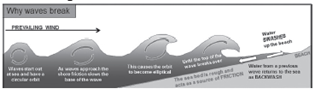
Wave Break Dynamics
Wave motion in open water is predominantly vertical, with water particles moving in circular orbits. This changes as waves approach the shoreline due to the interaction with the sea bed, which introduces several key phenomena:
- Friction with the Sea Bed: As waves near the coast, the sea bed exerts a frictional drag on the base of the wave. This friction transforms the wave’s circular motion into an elliptical one, indicating that the wave’s energy is starting to interact with the ocean bottom.
- Wave Velocity Changes: The frictional force is not uniform across the wave. The top (crest) of the wave experiences less friction than the base, causing the crest to move faster. This differential speed increases as the wave approaches shallow water.
- Formation of Breaking Waves: When the wave’s crest moves significantly faster than its base, it eventually overtops, leading to the wave breaking. This process is influenced by the sea bed’s slope and the wave’s energy.
- Coastline Interaction: Breaking waves are further influenced by water returning to the sea, which can disrupt the wave’s motion. This interaction between incoming waves and backwash shapes the coastline.
Swash and Backwash
The interaction of waves with the beach results in two primary movements:
- Swash: This is the movement of water and sediment up the beach, propelled by the energy of breaking waves. The direction and strength of swash are influenced by the prevailing wind direction.
- Backwash: Water recedes back into the sea, guided by the slope of the beach. Unlike swash, backwash moves at right angles to the slope, pulling materials back into the ocean.
Together, swash and backwash contribute to Longshore Drift, a process that transports sediment along the coastline in a zig-zag pattern, reshaping beaches over time.
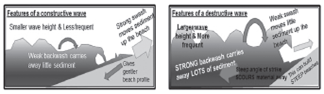
Constructive vs. Destructive Waves
The nature of waves and their impact on beach profiles can be categorized into two types:
- Constructive Waves: Characterized by a larger swash than backwash, these waves gently build up the beach by depositing material. They have low heights, break less frequently, and are less steep, often originating from distant storms. Constructive waves contribute to a gentle beach slope.
- Destructive Waves: With a backwash that exceeds the swash, these waves erode the beach, carrying sand and pebbles back into the sea. Destructive waves are steeper, with higher crests and more frequent breaks, leading to a steeper beach profile.
Tides
Tides are a complex yet fascinating natural phenomenon that involves the rhythmic rise and fall of sea levels. This movement is primarily influenced by the gravitational interactions between the Earth, Moon, and Sun, along with the Earth’s rotation. Understanding tides is crucial for navigation, fishing, and coastal management.
Tides are caused by the combined effects of several forces, primarily the gravitational pull of the Moon and the Sun on the Earth’s oceans, and the centrifugal force resulting from the Earth’s rotation. The gravitational attraction of the Moon and the Sun causes the water in the Earth’s oceans to bulge, leading to high tides, while the areas not under these celestial bodies experience low tides.
Tide Tables
- To predict the times and amplitude (height) of tides at any given location, tide tables are used. These tables are essential for planning maritime activities, ensuring the safety of ships entering or leaving ports, and for recreational activities along the coast.
Factors Influencing Tides
1.Moon’s Gravitational Pull: The Moon’s gravity is the dominant force affecting the Earth’s tides. It pulls the ocean’s water towards itself, creating a bulge or high tide in the ocean facing the Moon. On the opposite side of the Earth, another high tide occurs due to the inertia of the water.
2. Sun’s Gravitational Pull: While the Sun’s gravitational pull on the Earth is less influential compared to the Moon’s due to the greater distance, it still significantly impacts tides. When the Earth, Moon, and Sun align (during new and full moons), the tidal effects are amplified, leading to exceptionally high and low tides known as spring tides.
3. Centrifugal Force: As the Earth rotates, centrifugal force pushes outward, affecting the distribution of the Earth’s oceans. This force works in conjunction with the gravitational pulls to shape the tides.
Types of Tides
Based on the frequency and pattern of tides, they can be classified into three main types:
1.Semi-diurnal Tides: This is the most common tide pattern, characterized by two high tides and two low tides each day, with the high and low tides being approximately of the same height. This pattern is typical in many parts of the world and is predictable.

2. Diurnal Tides: In some regions, there is only one high tide and one low tide within a 24-hour period. The heights of these tides are approximately the same. Diurnal tides are less common and can be observed in some areas of the Gulf of Mexico and Southeast Asia.
3. Mixed Tides: Mixed tides exhibit variations in height and are known for having a significant difference between the successive high and low waters. This pattern is prevalent on the west coast of North America, where the Pacific Ocean’s vast expanse interacts with the continental shelf and coastline topology to produce mixed tides.
Gravitational and Centrifugal Forces in Tides
The interplay between gravitational forces (from the Moon and the Sun) and the Earth’s centrifugal force is the key to understanding tides. The gravitational pull of the Moon and the Sun creates bulges in the Earth’s oceans, leading to high tides, while the areas between these bulges experience low tides. The centrifugal force, resulting from the Earth’s rotation, counters these gravitational forces to some extent, balancing the tidal effects.
Based on Sun, Moon and Earth’s Position
Spring Tides
Spring tides, often referred to as “King Tides,” occur during the new and full moon phases, approximately twice each month. The term “spring” in this context is derived from the idea of the tide “springing forth,” rather than the season of spring.
Characteristics and Causes
- Alignment: During a spring tide, the Earth, Sun, and Moon align either in a straight line (during a full moon, with the Earth between the Moon and the Sun) or in a configuration where the Moon is between the Sun and the Earth (during a new moon).
- Gravitational Forces: In both cases, the Sun’s gravitational pull aligns with the Moon’s gravitational pull on the Earth, enhancing the overall gravitational effect on the Earth’s oceans.
- Tidal Impact: The result is a greater than average bulge in the Earth’s oceans, leading to higher high tides and lower low tides. These tides are more pronounced and can lead to flooding in low-lying coastal areas.
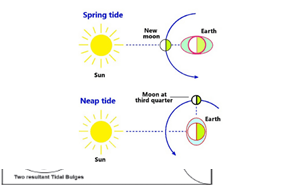
Neap Tides
Neap tides occur approximately seven days after spring tides, during the first and third quarter moon phases, when the Sun and Moon form a right angle relative to the Earth.
Characteristics and Causes
- Positioning: This right-angle configuration reduces the gravitational pull on the Earth’s oceans because the Sun’s gravitational force partially cancels out the Moon’s gravitational force.
- Moderate Tides: As a result, the ocean’s bulge is less pronounced, leading to moderate tides. During neap tides, the difference between high and low tides is less marked, resulting in lower high tides and higher low tides compared to other times.
- Frequency: Neap tides occur twice each lunar month and are predictable, offering a period of relatively stable and moderate tidal conditions.
Magnitude of Tides
| Based on the Perigee and Apogee of the Moon | Based on the Perihelion and Aphelion of the Earth |
| · Perigee: This term refers to the point in the Moon’s orbit where it is closest to the Earth. During perigee, the gravitational pull of the Moon on the Earth’s oceans is stronger than average, leading to higher high tides and lower low tides. The result is a greater tidal range, which is the difference between the high tide and the low tide. This phenomenon can enhance the impact of coastal flooding and erosion during this period.
· Apogee: Conversely, apogee is the point in the Moon’s orbit when it is farthest from the Earth. The Moon’s gravitational influence on the Earth’s tides is weaker when it is at apogee, resulting in tidal ranges that are less pronounced than average. High tides are not as high, and low tides are not as low, which may affect marine navigation and activities in tidal areas. |
· Perihelion: Occurring around the 3rd of January each year, perihelion is when the Earth is closest to the Sun. Despite the greater distance between the Earth and the Moon compared to the distance between the Earth and the Sun, the Sun’s immense mass means its gravitational pull still significantly influences Earth’s tides. During perihelion, the Earth experiences greater tidal ranges, similar to those during the Moon’s perigee. The gravitational pull from the Sun adds to the tidal effects, leading to unusually high and unusually low tides.
· Aphelion: Around the 4th of July each year, the Earth reaches aphelion, its farthest point from the Sun. During this time, the Sun’s gravitational pull on the Earth’s oceans is slightly diminished, leading to tidal ranges that are smaller than average. This means that the high tides are not as high, and the low tides are not as low, compared to other times of the year. |
Impacts of Tides
1.Ocean Life
- Impact: Significantly influences reproductive activities of marine organisms.
- Details: The movement of tides affects the distribution and availability of nutrients in coastal waters, essential for the reproductive cycles of many fish and ocean plants. This cyclical nutrient distribution supports a diverse range of marine life, ensuring sustainability of species.
2. Food and Habitat Source
- Impact: Essential for the survival of various sea creatures.
- Details: Tides contribute to the dynamic environment where organisms such as crabs, mussels, snails, and seaweeds thrive. The regular washing of tides replenishes nutrients and oxygen, cleanses habitats, and facilitates the movement of organisms, ensuring a rich and complex marine ecosystem.
3. Moderate Temperature
- Impact: Helps in maintaining climatic conditions around marine habitats.
- Details: Tidal movements mix colder arctic waters with warmer tropical waters, aiding in temperature regulation. This mixing is crucial for creating stable conditions that support diverse marine life, as it ensures that temperatures do not become too extreme for organisms to survive.
4. Removes Pollution
- Impact: Aids in cleaning up polluted water bodies.
- Details: Tides play a vital role in natural water purification processes, especially in river estuaries where they help in desilting and removing pollutants. This continuous renewal and flushing keep waterways healthier and less prone to eutrophication and other pollution-related issues.
5. Mangroves
- Impact: Supports the growth and formation of mangrove forests.
- Details: Mangroves, crucial for coastal protection and biodiversity, rely on tidal movements for sediment and nutrient distribution. Tides also facilitate mangrove pollination and seed dispersal, contributing to the resilience and expansion of these ecosystems.
6. Navigational Help
- Impact: Provides essential information for navigation.
- Details: Understanding tidal patterns is crucial for navigators and fishermen, impacting the planning of voyages and fishing activities. Tidal knowledge helps in avoiding shallow areas during low tides and in taking advantage of tidal currents to save fuel and time.
Tidal bores
Tidal bores represent one of the most dramatic and powerful interactions between the sea and river environments. A tidal bore is essentially a surge wave that occurs when the leading edge of the incoming tide forms a wave of water that travels up a river or narrow estuary against the direction of the river’s current.
What is a Tidal Bore?

- Definition: A tidal bore is a strong tide that pushes upriver against the current, creating a noticeable wave front. This phenomenon is considered a true tidal wave, distinct from the often misapplied term for a tsunami.
- Nature of Surge: Tidal bores are classified as positive surges, meaning they involve a sudden increase in water depth. This sudden change can significantly affect the river’s flow and ecosystem.
Formation of Tidal Bores
- Conditions for Formation: Tidal bores form under specific conditions, usually in river mouths that empty into the sea or ocean where there is a large tidal range. Factors influencing their development include the river’s depth, the shape of the river mouth, the presence of shallow bars or islands, and environmental factors like wind.
- Mechanism: The mechanism behind a tidal bore involves the incoming tide moving into a narrow or shallow river mouth, compressing and forming a wave that travels upstream. This is facilitated by the geographical and hydrological conditions of the river estuary.
Examples of Tidal Bores
- The Amazon’s Pororoca: The Amazon River, known for its immense volume and flow, experiences a significant tidal bore known as the pororoca. Despite the river’s width, the shallow mouth and presence of islands and sandbars enable the formation of this powerful tidal bore, which can travel great distances upstream.
- Historical Examples: The Seine River in France once featured a notable tidal bore, the mascaret. However, human interventions like dredging, dam construction, and river management practices have eliminated this phenomenon in many places.
Impacts of Tidal Bores
- Ecological Effects: Tidal bores can have profound impacts on the ecology of the river estuary. The force of the bore can disrupt habitats, affect animal behavior, and alter the distribution of sediments and nutrients.
- Sediment and Water Color Changes: The strong currents and turbulence associated with tidal bores can churn up sediment, changing the water color and affecting light penetration, which in turn impacts aquatic life.
- Human Challenges and Adaptations: Tidal bores pose challenges to navigation and shipping, necessitating the use of advanced technology and local knowledge to predict and mitigate their effects. Sophisticated instruments and geographic information systems (GIS) are employed to understand and navigate these dynamic conditions.
Human Interaction and Influence
- Modifications and Consequences: Human activities, including river modification and management, can alter or eliminate tidal bores. These changes can have long-lasting impacts on river ecosystems and local communities that may have historically relied on or coexisted with these natural phenomena.
- Conservation and Study: Understanding and preserving tidal bores has gained importance, both for their ecological significance and as attractions. Efforts to study and sometimes rehabilitate tidal bore-affected rivers highlight the balance between human needs and environmental preservation.
Ocean Currents
Ocean currents are significant components of the Earth’s climate system, acting as conveyor belts that transfer heat, nutrients, and salt across vast distances in the oceans. These currents play a crucial role in regulating the climate by influencing weather patterns and the distribution of biological organisms.
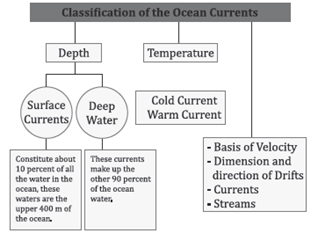
- Nature: Ocean currents are essentially massive, continuous movements of seawater. These currents follow specific paths and directions, much like rivers within the ocean, and are both continuous and predictable.
- Function: They help distribute thermal energy from the equator towards the poles, moderating global climate and facilitating marine life by transporting nutrients.
Primary Forces Driving Ocean Currents
1.Heating by Solar Energy (Insolation): Solar heating causes water to expand, creating a slight elevation of the water surface near the equator compared to mid-latitudes. This differential heating initiates the movement of water, contributing to the formation of currents.
2. Wind: The friction between wind and the ocean surface pushes water to move, with surface currents largely mirroring the prevailing wind directions. This interaction is a significant driver of ocean currents.
3. Gravitational Force: It pulls water down, creating gradient variations in water levels, which in turn influence ocean currents.
4. Coriolis Force: Resulting from the Earth’s rotation, this force causes water to veer to the right in the Northern Hemisphere and to the left in the Southern Hemisphere, affecting the direction of ocean currents.
5. Accumulation of Water (Gyres): Large accumulations of water due to factors like wind, Coriolis force, and landmasses create gyres, which are large circular currents present in all ocean basins.
Secondary Forces Influencing Ocean Currents
1.Density: Variations in water density, affected by salinity and temperature, influence the vertical movement of ocean currents. Denser (colder or saltier) water tends to sink, while less dense (warmer or fresher) water tends to rise.
2. Temperature: The temperature of water plays a critical role, with cold-water currents originating from the poles where water sinks and moves toward the equator, and warm-water currents flowing from the equator towards the poles.
Types of Ocean Currents
- Surface Currents: These are driven primarily by wind and follow major wind patterns. They can be warm or cold currents, affecting climate and weather patterns over landmasses they flow past.
- Deep Water Currents: Also known as thermohaline circulation, these currents are driven by density differences resulting from temperature and salinity variations. They play a crucial role in global heat distribution and carbon cycling.
Impacts of Ocean Currents
- Climate Regulation: By transferring heat from tropical to polar regions, ocean currents play a vital role in regulating global climate and weather patterns.
- Marine Ecosystems: Currents distribute nutrients, which are essential for marine ecosystems, supporting a wide range of marine life.
- Navigation and Shipping: Ocean currents impact maritime navigation and shipping routes, influencing travel time and fuel consumption.
- Coastal Effects: Currents can affect coastal conditions by influencing temperatures, precipitation patterns, and even contributing to coastal erosion.
Characteristics of Warm and Cold Currents
| Characteristic | Warm Current | Cold Current |
| Geographical Location | Usually observed in the east coast of continents in the lower and middle latitudes. | Usually observed in the west coast of continents in the lower and middle latitudes. |
| Temperature Influence | Brings warm water into the cold-water areas. | Brings cold water into the warm-water areas. |
| Latitudinal Preference | In the west coast of the Northern Hemisphere, they are found in the higher latitudes. | In the east coast of the Northern Hemisphere, they are found in the higher latitudes. |
Modifying Factors of Ocean Currents
| Factor | Description |
| Rotation of Earth | Earth rotates on its axis from west to east, generating the Coriolis force which deflects the general direction of ocean currents.
Causes movement of ocean water near the equator in opposite directions (e.g., Equatorial Current). |
| Factors Related to Ocean | Temperature:
High temperature in equatorial regions decreases water density due to expansion. Salinity: Increases in salinity raise water density, generating currents from low to high salinity areas. Density: Water moves from areas of low density to higher density. |
| Factors Related to Atmosphere | Air Pressure and Winds:
Variations in air pressure cause ocean currents through density changes. Rainfall and Evaporation: Sea level is higher in areas of low evaporation and high rainfall, leading to low salinity and density. |
| Shape, Direction, and Configuration of Coastlines | Depositional coastlines that flow perpendicular to the natural flow direction of ocean currents can obstruct and redirect currents to flow parallel to the coastline. |
| Bottom Relief | The bottom relief of the ocean, with its irregularities, modifies the ocean current at both the surface and the bottom. |
| Seasonal Variation | Changes in weather, such as monsoon conditions, affect the ocean currents by disturbing their natural flow. |
Effects of Ocean Currents
Ocean currents play a pivotal role in shaping the climate, weather patterns, and marine ecosystems across the globe. These currents are large-scale movements of seawater, driven by factors such as wind, salinity levels, Earth’s rotation, and temperature gradients. Their effects are far-reaching, impacting not only the immediate marine environment but also terrestrial climates and weather phenomena.
Climatic Conditions
- Example: The British Isles experience a relatively mild climate compared to other regions at similar latitudes due to the warm North Atlantic Drift. This ocean current, part of the larger Atlantic Meridional Overturning Circulation, brings warm water from the Gulf of Mexico across the Atlantic Ocean to Europe. In contrast, the cold Peru (or Humboldt) Current along the western coast of South America cools the adjacent land areas, moderating the climate of regions like Peru, which would otherwise be much warmer.
Rainfall Patterns
- Example: The presence of cold ocean currents, such as the Benguela Current along the coast of southwestern Africa, can lead to reduced evaporation rates over the ocean. This reduction in evaporation can decrease moisture availability in the air, leading to less rainfall over adjacent land areas. The Kalahari Desert’s aridity is partly attributed to this phenomenon, as the cold Benguela Current limits the amount of moisture that would otherwise contribute to rainfall in the region.
Desert Formation
- Example: The Atacama Desert in South America, one of the driest places on Earth, owes its aridity to the cold Humboldt (Peru) Current. This current cools the air above the ocean, reducing its capacity to carry moisture. As a result, the coastal regions and nearby inland areas experience extremely low precipitation levels, contributing to the desert’s formation and persistence.
Fog Formation
- Mechanism: Advection fog occurs when warm, moist air moves over a colder surface, such as the ocean’s surface cooled by a cold current. The interaction causes the air to cool down and its moisture to condense into fog. This type of fog is common in areas where warm and cold ocean currents meet, and it can extend to affect adjacent coastal regions.
- Example: The U.S. Pacific coastline frequently experiences advection fog, particularly in regions where the cold California Current flows southward along the coast. The contrast between the cold ocean water and the warmer air leads to the formation of dense fog that can envelop coastal communities and maritime vessels.
Fishing Zones
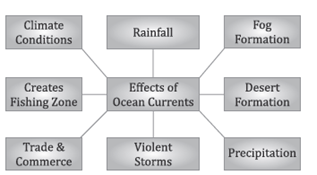
- Impact: Ocean currents significantly influence marine productivity and the distribution of marine life, including fish. Cold currents are typically nutrient-rich, fostering the growth of plankton, which serves as the foundational food source for larger marine organisms, including commercially important fish species. Conversely, warm currents may offer less favorable conditions for plankton growth, leading to less productive fishing grounds.
Violent Storms and Precipitation
- Mechanism: The evaporation of ocean water is a key process in the formation of rain and storms. Warm ocean currents contribute to higher evaporation rates, which increase moisture content in the air. This moist air can form rainclouds and precipitation, often carried over long distances by atmospheric currents. The interaction between ocean and atmospheric dynamics is crucial for the distribution of precipitation globally.
- Global Climate Regulation: Ocean currents act as a global conveyor belt, redistributing heat and moisture around the planet. This process helps to mitigate the uneven distribution of solar radiation, influencing climate and weather patterns on a global scale. By transporting warm water from the equator towards the poles and vice versa, ocean currents play an essential role in maintaining the Earth’s energy balance and climate system.
Detailed Information about Some of the Currents
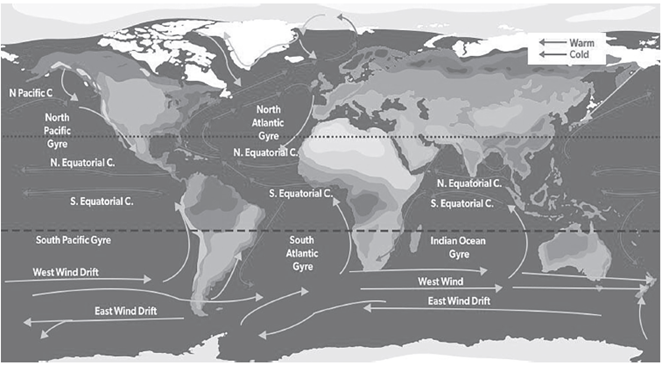
| Current Name | Nature | Expanded Details |
| North Equatorial Current | Warm | Flows east to west in all oceans except the Arctic. This current plays a crucial role in the transfer of warm water across the ocean, influencing regional climate patterns by modulating sea surface temperatures. Its flow contributes to the gyre circulation in each ocean, impacting weather systems and marine ecosystems by affecting sea surface temperature gradients. |
| South Equatorial Current | Warm | Similar to its northern counterpart, the South Equatorial Current also flows from east to west, forming part of the subtropical gyre. It affects equatorial and subtropical regions by transporting warm water and influencing climate and weather patterns. The current supports marine biodiversity by redistributing heat and nutrients across vast distances, thus playing a critical role in ocean productivity. |
| Equatorial Counter Current | Warm | Lies between the North and South Equatorial Currents, flowing in the opposite direction from west to east. This current provides a mechanism for returning warm surface waters towards the eastern Pacific and Atlantic, helping to balance the oceanic flow system. It can influence El Niño and La Niña events by affecting the distribution of warm surface waters, thereby having a significant impact on global climate phenomena. |
| Antarctic Circumpolar Current | Cold | Encircles Antarctica, flowing from west to east. It’s the only ocean current that circumnavigates the Earth and connects the Atlantic, Pacific, and Indian Oceans. The ACC plays a pivotal role in global climate by facilitating the exchange of water masses between the oceans, regulating global sea temperatures, and carbon storage. Its strong flow and vast reach make it a crucial component of the Earth’s climate system. |
| Humboldt or Peruvian Current | Cold | Extends from southern Chile to northern Peru along the west coast of South America. This cold, low-salinity current is renowned for its rich marine ecosystem, supported by the upwelling of nutrient-rich deep waters. The Humboldt Current significantly influences local climates by cooling coastal temperatures and is vital for one of the world’s largest fisheries, supporting a diverse marine food web. |
| Kurile or Oyashio Current | Cold | This sub-arctic current flows southward from the Arctic Ocean through the Bering Sea, carrying cold, nutrient-rich waters to the western North Pacific. Its interaction with the Kuroshio Current forms the North Pacific Drift, significantly impacting the marine climate and ecosystems of the North Pacific. The current’s nutrients support high productivity and biodiversity, essential for the regional fishing industry. |
| California Current | Cold | A southward extension of the Aleutian Current along the west coast of North America, part of the North Pacific Gyre. Characterized by strong upwelling, it brings nutrient-rich deep waters to the surface, supporting abundant marine life and important fisheries. The current influences coastal climates by moderating temperatures, making it crucial for the ecological and economic well-being of the region. |
| Labrador Current | Cold | Flows southward from the Arctic Ocean, carrying cold, fresh water that influences the North Atlantic’s marine climate. When meeting the warm Gulf Stream, it creates fertile fishing grounds due to the mixing of cold and warm waters, which enhances marine productivity. The current also plays a role in transporting Arctic icebergs into the North Atlantic, affecting shipping lanes and climate through the freshwater it adds to the ocean. |
| Canary Current | Cold | Stretches from the Fram Strait to Cape Farewell, linking the Arctic Ocean to the North Atlantic. This current is a major freshwater sink and contributes significantly to the export of sea ice from the Arctic. Its flow moderates the climate of the Canary Islands and northwestern Africa, supporting rich marine ecosystems and affecting regional weather patterns. |
| Benguela Current | Cold | This current is a branch of the Southern Hemisphere’s West Wind Drift, part of the South Atlantic Ocean Gyre. Known for its low salinity and upwelling zones, it provides excellent conditions for fishing due to the nutrient-rich waters that support high biological productivity. The Benguela Current influences the climate of southwestern Africa, contributing to the region’s aridity while supporting one of the most productive marine ecosystems. |
| Falkland Current | Cold | A branch of the Antarctic Circumpolar Current, known locally as the Malvinas Current. It flows northward along the east coast of South America, mixing with the warm Brazil Current to form the Brazil-Malvinas Confluence Zone. This interaction creates a unique temperate climate zone and supports diverse marine |
Ocean Mean Temperature (OMT)
1.Definition and Importance
- OMT refers to the average temperature of the ocean water up to a certain depth, where the temperature is uniform or nearly so. This measure is critical in understanding the thermal energy stored in the upper layers of the ocean.
- It plays a pivotal role in predicting climatic phenomena such as the Indian Monsoon, which is vital for agriculture, water resources, and overall economic planning in the region.
2. Measurement Period
- The analysis and measurement of OMT are conducted during the January to March period each year. This timeframe is crucial as it precedes the onset of the Indian Monsoon, allowing for accurate predictions based on the thermal conditions of the ocean.
3. Comparison with SST
- While Sea Surface Temperature (SST) measures the temperature of the ocean’s surface, OMT provides a more comprehensive view by considering the temperature up to a certain depth. This depth is defined by the 26-degree Celsius isotherm, which typically varies between 50 to 100 meters below the ocean surface.
- OMT offers a more stable and consistent metric for predicting the monsoon, with less spatial variability compared to SST. This stability and reduced variability make OMT a superior indicator for forecasting monsoon patterns.
4. The 26-Degree Celsius Isotherm
- The choice of the 26-degree Celsius isotherm as a benchmark for measuring OMT is significant. This temperature threshold is critical for the formation of monsoon clouds and the initiation of the monsoon cycle.
- The depth of this isotherm varies but is a crucial indicator of the thermal energy available in the upper ocean. During the January-March period, the mean depth of the 26-degree Celsius isotherm in the Southwestern Indian Ocean is approximately 59 meters, indicating the thermal conditions conducive to the onset of the Indian Monsoon.
5. Advantages Over SST
- OMT’s representation of upper thermal conditions is more comprehensive than that of SST. By measuring the temperature up to the depth of the 26-degree Celsius isotherm, OMT captures the thermal energy available in the upper ocean layers more accurately.
- This comprehensive measure allows for a better prediction of the Indian Monsoon, as it takes into account the thermal energy that influences monsoon dynamics, rather than just the surface temperature.
Gyres: The Circulatory System of the Ocean
Gyres are vast circular ocean currents that play a crucial role in the Earth’s climate system and marine ecosystems. These large-scale patterns of water movement are driven by a combination of the planet’s wind patterns, the rotation of the Earth, and the configuration of continental landmasses. Understanding gyres is essential for grasping how the ocean influences climate, marine life distributions, and global cycles of nutrients and carbon.
Formation of Gyres
Gyres form through the interplay of three primary forces:
1. Global Wind Patterns: Winds blowing across the surface of the ocean exert a force on the water, causing it to move. These winds, including the trade winds in the tropics and the westerlies in mid-latitudes, are themselves driven by the uneven heating of the Earth’s surface by the sun.
2. Earth’s Rotation: The rotation of the Earth impacts the movement of ocean currents through the Coriolis effect. This phenomenon causes moving objects, including air and water, to be deflected to the right in the Northern Hemisphere and to the left in the Southern Hemisphere, giving gyres their characteristic clockwise or counterclockwise rotation.
3. Earth’s Landmasses: The configuration of continents and islands can block or steer the flow of ocean currents, shaping the boundaries and paths of gyres. For example, the presence of large landmasses like Australia and South America helps define the extent of the South Pacific Gyre.
The Coriolis Effect and Ekman Spiral
The Coriolis effect not only shifts surface currents by approximately 45 degrees relative to the wind direction but also contributes to a phenomenon known as the Ekman spiral. Below the surface, the direction of water flow changes with depth, creating a spiral effect due to the Coriolis force and friction between layers of water. This spiral influences the vertical structure of gyres and contributes to upwelling and downwelling in different parts of the ocean.
The Role of Gyres in the Ocean Conveyor Belt
Gyres are integral components of the “Ocean Conveyor Belt,” a global circulation system that moves ocean water around the planet. Officially known as the thermohaline circulation, this system is driven by differences in water temperature and salinity, which affect water density. Gyres contribute to this system by moving warm and cold water across the globe, helping to regulate the Earth’s climate by distributing heat and influencing weather patterns.
Impacts on Marine Ecosystems and Climate
The movement of gyres affects marine ecosystems by distributing nutrients and affecting the migration patterns of marine species. Gyres can bring nutrient-rich cold water from the deep to the surface, supporting plankton growth and the marine food web. Additionally, by influencing climate and weather patterns, gyres play a role in human activities, affecting fishing, shipping, and even weather forecasting.
Examples of Ocean Gyres
- The South Pacific Gyre: One of the largest, bounded by Australia, South America, the Equator, and the Antarctic Circumpolar Current. It is characterized by vast expanses of open ocean.
- The Northern Indian Ocean Gyre: Smaller and significantly influenced by surrounding landmasses such as the Horn of Africa, Sri Lanka, the Indian subcontinent, and the Indonesian archipelago. Its dynamics are also affected by seasonal changes in wind patterns.
Types of Gyres
Subpolar Gyres
- Location and Formation: Subpolar gyres form in the polar regions of the planet, situated beneath areas of low atmospheric pressure. The climate in these regions is significantly influenced by the cold, dense air that characterizes low-pressure systems.
- Characteristics: The winds around subpolar gyres drive surface currents away from coastal areas. This movement of surface water is compensated by the upwelling of cold, nutrient-rich water from the depths. Such upwelling zones are vital for marine ecosystems, supporting high levels of primary productivity and diverse marine life.
- Examples: The Northern Hemisphere features several subpolar gyres, with their boundaries often defined by islands and landmasses such as Iceland, Greenland, and the Aleutians, as well as the northern reaches of Scandinavia, Asia, and North America. These gyres contribute to the cold, nutrient-rich conditions of the northern oceans.
Tropical Gyres
- Location and Formation: Tropical gyres form closer to the Equator, where the Coriolis effect—the force that causes the deflection of moving objects due to Earth’s rotation—is minimal. The primary drivers of these gyres are wind patterns that flow in a more east-west direction rather than forming a circular pattern.
- Characteristics: Due to the weak Coriolis effect at equatorial latitudes, tropical gyres exhibit less pronounced circular motion and are more influenced by direct wind patterns. This results in currents that primarily move laterally across the ocean, transporting warm water and influencing climate patterns along tropical coastlines.
- Examples: The Indian Ocean Gyre, which consists of the northern and southern Indian Ocean Gyres, exemplifies tropical gyres. These gyres play a crucial role in the oceanic circulation and climate of the tropical Indian Ocean region.
Subtropical Gyres
- Location and Formation: Subtropical gyres are found beneath regions of high atmospheric pressure and are characteristic of the more temperate latitudes of the oceans. These areas of high pressure contribute to the stability and persistence of subtropical gyres.
- Characteristics: Subtropical gyres encompass vast areas of the ocean, often thousands of kilometers in diameter. They are marked by relatively calm and stable central regions where ocean water tends to remain stationary, while currents at the edges of the gyre circulate around this central area. The stability of these central zones makes them distinct from the more dynamic coastal regions.
- Examples: The North Pacific Gyre, the South Pacific Gyre, the North Atlantic Gyre, and the South Atlantic Gyre are prominent examples of subtropical gyres. These gyres are crucial for the transport of heat, nutrients, and marine organisms across vast oceanic distances, influencing global climate patterns and marine biodiversity.
Each type of gyre contributes in its own way to the Earth’s climate, marine ecosystems, and the global circulation of ocean waters. Understanding these gyres is essential for comprehending the complex interactions between the ocean and atmosphere that drive the Earth’s climate and weather patterns.
Atlantic Meridional Overturning Circulation (AMOC)
The Atlantic Meridional Overturning Circulation (AMOC) is a crucial component of Earth’s climate system, characterized by a complex network of ocean currents that plays a significant role in the distribution of heat and energy across the planet. This system, often likened to a giant conveyor belt, involves the movement of warm, salty water from the tropics to the North Atlantic, and the return flow of cold, dense water from the north to the south. Understanding the AMOC is essential for grasping how the ocean affects climate patterns globally.
1.Fundamental Mechanics of AMOC
a. Thermohaline Circulation
The AMOC is part of the larger thermohaline circulation, which is driven by differences in water density, regulated by temperature (thermo) and salinity (haline). This density difference creates a global-scale flow of ocean water.
b. Warm Water Pathway
The journey begins in the tropics, where the sun’s heat warms surface waters. This warm, less dense water then flows northwards along the surface of the Atlantic Ocean, transporting heat energy towards higher latitudes.
c. Cooling and Sinking
As the warm water travels north, it loses heat to the atmosphere, particularly in the North Atlantic, where the climate is cooler. The cooling is accompanied by evaporation, which increases the salinity and density of the water. This denser water begins to sink into the deep ocean, a process predominantly occurring in the Greenland Sea and the Labrador Sea.
2. Deep Ocean Circulation
a. Southward Flow
Once submerged, this cold, dense water starts its slow journey back towards the equator and further south, flowing several kilometers below the surface. This deep-water movement is an essential aspect of the AMOC, ensuring the transfer of cold water across vast oceanic distances.
b. Upwelling
The cycle is completed when this deep, cold water eventually returns to the surface through upwelling, a process that can occur in various parts of the world’s oceans but is notably significant along the western coasts of continents, such as the Pacific coast of South America. Upwelling brings nutrient-rich water to the surface, supporting marine ecosystems.
3. Impact on Global Climate
The AMOC has a profound impact on global climate systems. By redistributing heat from the equator towards the poles, it influences weather patterns, sea surface temperatures, and even the rate of ice melting in the polar regions.
- Climate Moderation: The heat transported northwards by the AMOC contributes to the relatively mild climates of Northwestern Europe, which are warmer than other regions at similar latitudes.
- Climate Change Sensitivity: Changes in the AMOC’s strength or direction can have significant climate implications. A slowdown, for instance, could lead to cooler temperatures in Europe, more extreme weather events, and rising sea levels on the eastern coast of the U.S.
4. Research and Monitoring
Given its importance, the AMOC is closely monitored through a combination of satellite data, ocean sensor arrays, and climate models. This research helps scientists understand how the AMOC is responding to global warming and what future changes might mean for global climate patterns.
Effect of Climate Change in AMOC
The potential weakening of the Atlantic Meridional Overturning Circulation (AMOC) due to climate change is a subject of considerable scientific interest and concern. Climate models project that as concentrations of greenhouse gases increase throughout the 21st century, the AMOC will likely experience a reduction in its strength. This weakening can be attributed to a combination of factors related to the warming climate, including changes in sea surface temperatures, freshwater influx, and alterations in atmospheric conditions.
Causes of AMOC Slowdown
1.Increased Atmospheric Temperatures: As greenhouse gas emissions trap more heat in the Earth’s atmosphere, the surface ocean retains more heat. Warmer water is less dense than cooler water, reducing the ocean’s ability to facilitate the deep water formation that drives the AMOC.
2. Freshwater Influx: The warming climate leads to increased rainfall in some regions and accelerated ice melt in Greenland and other areas. This influx of freshwater dilutes the ocean’s salinity, making surface waters lighter and further inhibiting the sinking process that is critical for the continuation of the AMOC’s conveyor belt-like circulation.
3. Altered Atmospheric Circulation: Climate change can also alter atmospheric wind patterns and storm tracks, which can impact ocean surface currents and, indirectly, the AMOC.
Impact of AMOC Slowdown
1.Reduced Heat Transport: A weaker AMOC means less warm water is transported northward across the Atlantic. This could lead to cooler surface temperatures in parts of Europe and North America, which would counteract some of the warming effects of greenhouse gases, at least regionally.
2. Climate Patterns and Weather Extremes: Changes in the AMOC can alter climate patterns worldwide, potentially leading to more extreme weather events, including increased storminess and changes in precipitation patterns.
3. Sea Level Rise: A slowdown in the AMOC can lead to higher sea levels along the eastern coast of the United States due to the accumulation of water in the North Atlantic and changes in the Earth’s gravitational and rotational effects.
4. Impact on Marine Ecosystems: The redistribution of heat and changes in upwelling associated with a weaker AMOC can affect marine ecosystems, impacting fish populations, and other marine life by altering food availability and habitat conditions.
5. Global Warming Mitigation: While a weakening AMOC might temporarily offset some of the warming effects over specific regions such as western Europe, it is not expected to halt or reverse the overall trend of global warming. The global climate would still be on a trajectory of warming due to greenhouse gas emissions.
Monitoring and Future Projections
Since 2004, oceanographers have continuously monitored the AMOC, providing valuable data to assess its current state and predict future changes. Although current climate models and observations suggest that the AMOC will weaken over the 21st century, they also indicate that it is very unlikely for the AMOC to undergo large, rapid shifts similar to those that have occurred in the distant past within this century. However, the precise impacts of a weakened AMOC on global climate systems remain an area of active research. Understanding these effects is crucial for developing accurate climate models and implementing strategies to mitigate the adverse impacts of climate change.
Why is the AMOC Slowing Down?
1.Global Warming: The increase in atmospheric temperatures causes the surface waters of the oceans to warm up, reducing their density. Since the sinking of water in the North Atlantic, a critical component of the AMOC, depends on the water becoming sufficiently cold and dense, any factor that reduces this density can slow down the circulation.
2.Increased Freshwater from Melting Ice: The melting of ice caps and glaciers, particularly in Greenland, adds fresh water to the North Atlantic, decreasing the salinity—and thus the density—of the water. This freshening of the ocean surface further inhibits the sinking process that drives the AMOC.
3. Altered Atmospheric Conditions: Changes in atmospheric conditions, including wind patterns and precipitation, can also impact the AMOC. Increased rainfall and river runoff further dilute the ocean’s surface waters, affecting their density and the overall circulation pattern.
Impact of the AMOC’s Slowdown
1. Decrease in Marine Productivity: The Intergovernmental Panel on Climate Change (IPCC) has reported a weakening of the AMOC, which could lead to reduced marine productivity in the North Atlantic. This reduction in productivity affects fish populations and the broader marine ecosystem, impacting food chains and human economies dependent on marine resources.
2. ‘Cold Blob’ in the North Atlantic: The slowdown of the AMOC is linked to a phenomenon known as the ‘cold blob’—a region of anomalously cold water in the North Atlantic. This cold patch contrasts with the overall trend of global warming and can affect weather patterns across Europe and North America.
3. More Extreme Weather Events: A weakened AMOC may lead to changes in the winter storm tracks over the Atlantic, potentially making these storms more intense. This could result in increased storminess and precipitation over Europe, affecting millions of people.
4. Increased Drought in the Sahara: Changes in the AMOC can also influence rainfall patterns in Africa. A further slowdown could make the Sahara region more prone to drought, exacerbating water scarcity issues and impacting agricultural productivity.
Indian Ocean and AMOC – Climate Change
The interaction between the Indian Ocean’s warming and the Atlantic Meridional Overturning Circulation (AMOC) illustrates the interconnected nature of Earth’s climate system. Recent studies have suggested that rising temperatures in the Indian Ocean could have significant implications for the AMOC, potentially counteracting some of the weakening trends observed over the past 15 years. This complex dynamic involves various processes, including changes in precipitation patterns and the distribution of salt in ocean waters, which ultimately affect the AMOC’s strength and stability.
How Rising Temperatures in the Indian Ocean May Influence the AMOC
- Increased Precipitation in the Indian Ocean: As the Indian Ocean warms, it generates more precipitation. This increase in rainfall is associated with the warmer sea surface temperatures that enhance evaporation and, consequently, cloud formation and precipitation.
- Altered Global Air Circulation: The additional precipitation over the Indian Ocean draws more air from other parts of the world, including the Atlantic Ocean. This shift in air movement can lead to reduced rainfall over the Atlantic, increasing the salinity of surface waters.
- Impact on the AMOC: The saltier Atlantic water, due to reduced precipitation, becomes denser as it travels northward. When this saltier water reaches the higher latitudes of the North Atlantic, it cools down more quickly than less saline water would. This increased density due to both higher salinity and lower temperature accelerates the sinking process that is central to the AMOC. Essentially, the warming of the Indian Ocean and subsequent atmospheric changes can provide a “jump start” to the AMOC, enhancing its circulation.
- Influence of ENSO: The El Niño-Southern Oscillation (ENSO) is another crucial factor in this complex interplay. ENSO is a periodic variation in winds and sea surface temperatures over the tropical eastern Pacific Ocean, affecting climate across the globe. Changes in ENSO patterns can alter rainfall distribution in the tropics, further influencing the salinity and temperature distribution in the oceans and impacting the AMOC.
Implications of These Dynamics
The potential for the Indian Ocean’s warming to temporarily bolster the AMOC underscores the intricate linkages within the global climate system. While this may delay some of the negative impacts associated with the AMOC’s weakening, such as decreased marine productivity in the North Atlantic or shifts in weather patterns affecting Europe and North America, it also highlights the complexity of predicting climate change outcomes.
Moreover, these interactions emphasize the importance of considering global climate patterns’ interconnectedness when assessing the impacts of ocean warming and climate change. While the Indian Ocean’s warming may offer short-term support for the AMOC, the long-term effects of ongoing global warming, including ice melt and increased freshwater inputs into the oceans, still pose significant challenges to the AMOC’s stability and the global climate system.
EL NINO
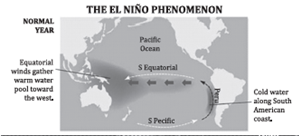
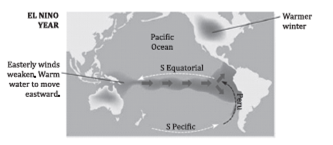
El Niño is a significant climate phenomenon with far-reaching effects on global weather patterns, marine life, and agriculture. It is characterized by the warming of surface waters in the eastern tropical Pacific Ocean, specifically along the coasts of Ecuador and Peru. This phenomenon is part of a larger climatic system known as the El Niño Southern Oscillation (ENSO), which also includes La Niña events, representing the opposite phase of cooler-than-average sea surface temperatures in the Pacific.
Definition and Meaning
- El Niño translates to “A Little Boy” in Spanish, named for its tendency to occur around Christmas.
- It represents a phase of ENSO where the surface waters of the eastern tropical Pacific Ocean warm significantly.
Occurrence and Duration
- El Niño events are not regular or predictable, occurring irregularly at intervals ranging from 2 to 7 years.
- They typically begin around Christmas and can last from a few weeks to several months, affecting weather patterns globally.
Mechanism
Upwelling Disruption
- Normally, the eastern Pacific experiences upwelling of cold, nutrient-rich deep ocean water. During El Niño, this upwelling is significantly reduced due to the warming of surface waters.
- This reduction in upwelling affects marine ecosystems and fish stocks, which rely on the nutrients brought up from the deep.
Reversal of the Walker Circulation
- The Walker Circulation, a pattern of atmospheric circulation, experiences a reversal during El Niño years.
- Normally, high pressure over the eastern Pacific and low pressure over the western Pacific drive winds from east to west, facilitating upwelling. During El Niño, this pattern is disrupted, leading to a weakening or reversal of the winds.
Impacts of El Niño
Weather Patterns
- El Niño can lead to significant weather anomalies, such as increased rainfall along the equatorial coast of South America and drought conditions in the western Pacific regions.
- It is also associated with weaker trade winds and a weakened Walker Circulation, allowing warm water to accumulate along the South American coast.
Marine Life
- The disruption of upwelling during El Niño impacts marine ecosystems, as the reduced supply of nutrients affects the food chain, impacting fisheries and marine biodiversity.
Global Effects
- The phenomenon can influence global weather patterns, leading to extreme weather events such as floods, droughts, and storms in various parts of the world.
El Niño vs. La Niña
- El Niño and La Niña represent opposite phases of the ENSO cycle. While El Niño is characterized by warmer-than-average sea surface temperatures in the eastern Pacific, La Niña features cooler-than-average sea surface temperatures.
- El Niño events tend to occur more frequently than La Niña, but both have profound effects on global climate patterns.
Comparison between Normal Conditions and El Niño
| Aspect | Normal Condition | El Niño Condition |
| Eastern Pacific (Coast of Peru and Ecuador) | Cold Ocean Water, Good for Fishing | Warm Ocean Water, Fishing industry takes a hit |
| Western Pacific (Indonesia and Australia) | Warm Ocean Water, Plenty of rain | Cold Ocean Water, Drought |
Impacts of El Niño
Impact on Australia and Indonesia
- Droughts: Caused by the settling down of air mass, leading to forest fires and large-scale coral bleaching.
Impact on Northern America
- Climate: Winters are warmer than normal, reducing cyclone conditions.
Impact on India and Monsoon Regions of Asia
- Climate and Agriculture: High chances of drought, affecting agricultural productivity and resulting in higher food inflation. The agricultural subsidy and banking credit supply are influenced by monsoon variations.
Global Ecology
- Climate Change: Warming and the rise in sea level, reduction in marine productivity, and melting of ice sheets.
- Weather Events: More cyclones in the Western Pacific and Indian Ocean region, contributing to forest fires.
LA NINA
La Niña is a climatic phenomenon that represents a significant component of the Earth’s climate variability, particularly influencing weather patterns across the globe. It is essentially the counterpart to El Niño, which is known for its warming effect on sea surface temperatures in the central and eastern Pacific Ocean.
Definition and Nomenclature
- La Niña, translating to “the Little Girl” in Spanish, refers to the cold phase of the El Niño-Southern Oscillation (ENSO) cycle. ENSO is a recurring climate pattern involving changes in the temperature of waters in the central and eastern tropical Pacific Ocean.
- This phenomenon is sometimes humorously referred to as El Viejo, “anti-El Niño,” or simply a “cold event,” highlighting its role as the cold counterpart to El Niño.
Formation and Characteristics
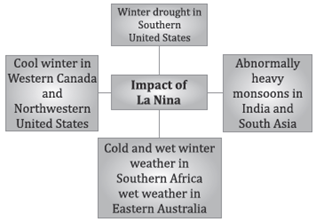
- La Niña events typically occur after an El Niño event; however, they do not happen after every El Niño. During La Niña, the trade winds strengthen and cause an increased upwelling of cold water from the depths of the ocean to the surface in the central and eastern Pacific Ocean. This process leads to an abnormal accumulation of cold water in these regions, markedly lowering sea surface temperatures.
- The phenomenon is characterized by below-average sea surface temperatures across the east-central Equatorial Pacific. This cooling effect has a broad impact on weather patterns due to the interconnectedness of atmospheric and oceanic systems.
Conditions Associated with La Niña
- Cooler Waters: The hallmark of La Niña is the buildup of cooler-than-normal waters in the tropical Pacific Ocean, specifically between the Tropic of Cancer and the Tropic of Capricorn. This cooling is not just a surface phenomenon but extends to varying depths below the ocean’s surface.
- Atmospheric Pressure Changes: La Niña influences atmospheric pressure, leading to lower-than-normal air pressure over the western Pacific. This condition fosters increased rainfall and storm activity in the region. Conversely, higher-than-normal pressure over the central and eastern Pacific tends to suppress rainfall, leading to drier conditions.
- Global Weather Impact: The effects of La Niña extend well beyond the Pacific Ocean, influencing weather patterns across the globe. For instance, it can lead to wetter conditions in Australia and Indonesia, colder and stormier winters in the northern United States, and drier conditions in the southern U.S.
Impacts of La Niña
The implications of La Niña are wide-ranging, affecting agriculture, water resources, health, energy demand, and disaster preparedness across different parts of the world. These impacts include, but are not limited to:
- Increased Rainfall: Regions like Southeast Asia, Australia, and the Amazon basin may experience higher-than-average rainfall, leading to flooding and impacts on agriculture.
- Drought: Areas such as the southwestern United States may face drought conditions, affecting water supply and increasing wildfire risks.
- Temperature Fluctuations: La Niña can lead to cooler temperatures in the Southeast Asia region and warmer conditions in the northwest United States and Canada during winter months.
El Niño Modoki
El Niño Modoki is a specific type of El Niño event characterized by its unique sea surface temperature (SST) anomaly pattern in the tropical Pacific Ocean.
- Location: Unlike the traditional El Niño, which is marked by significant warming in the eastern equatorial Pacific, El Niño Modoki features anomalous warming in the central tropical Pacific, flanked by cooler waters in the east and west.
Characteristics
- Sea Surface Temperature (SST): The central part of the tropical Pacific experiences higher than average SSTs during El Niño Modoki events.
- Atmospheric Impact: This phenomenon disrupts normal atmospheric circulation patterns, altering weather conditions worldwide differently than typical El Niño events.
La Niña Modoki
Overview
- Definition: La Niña Modoki is the counterpart to El Niño Modoki, characterized by cooler than normal SSTs in the central tropical Pacific.
- Location: It occurs with warmer SST anomalies in the eastern and western tropical Pacific, contrasting with the central cooling.
Characteristics
- Sea Surface Temperature (SST): The phenomenon involves lower than average SSTs in the center of the tropical Pacific Ocean.
- Atmospheric Circulation: La Niña Modoki influences global atmospheric circulation by generating two Walker circulation cells, leading to unique weather patterns distinct from typical La Niña events.
ENSO Modoki
Overview
- Definition: ENSO Modoki encompasses both El Niño Modoki and La Niña Modoki phases, representing a broader understanding of the central Pacific-based El Niño and La Niña phenomena.
- Significance: Research indicates that ENSO Modoki events have become more prominent in recent years, possibly due to global climate change, affecting weather patterns differently from the traditional ENSO.
Teleconnections
- Impact on Global Weather: ENSO Modoki affects various parts of the world through teleconnections, which are atmospheric interactions that link weather changes in one region to climate anomalies in another.
- Examples: During El Niño Modoki events, the west coast of the United States might experience drier conditions, whereas traditional El Niño events usually bring wetter weather.
Differences from Traditional ENSO Events
El Niño
- Traditional El Niño events cause significant warming in the eastern Pacific, leading to different atmospheric circulation and weather patterns compared to El Niño Modoki.
La Niña
- Traditional La Niña events are characterized by cooling in the eastern Pacific, as opposed to the central Pacific cooling seen in La Niña Modoki.
Madden-Julian Oscillation (MJO)
The Madden-Julian Oscillation (MJO) is a significant climatic phenomenon that plays a crucial role in modulating weather patterns across the globe, particularly in the tropics. It can be understood through a detailed examination of its characteristics, phases, and impacts on global weather, including the Indian monsoon and climate systems worldwide.
Characteristics of the MJO:
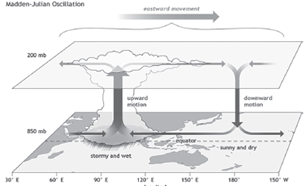
- Definition and Nature: The MJO is an oceanic-atmospheric phenomenon characterized by an eastward moving ‘pulse’ of cloud and rainfall near the equator that typically recurs every 30 to 60 days.
- Location and Movement: This phenomenon is most prominent over the Indian and Pacific Oceans, where it exhibits significant influence on weather patterns by modulating rainfall, winds, and atmospheric pressure.
- Phases: The MJO consists of two distinct phases – the enhanced convective phase and the suppressed convective phase. These phases influence global weather patterns in different ways, leading to a dichotomy in weather conditions across the planet.
Phases of the MJO:
1.Enhanced Convective Phase:
- During this phase, surface winds converge, causing air to ascend through the atmosphere. As the air rises, it cools and condenses, leading to increased rainfall and cloudiness.
- At higher altitudes, the winds diverge, further facilitating upward motion and condensation, which enhances rainfall.
2. Suppressed Convective Phase:
- Conversely, during the suppressed phase, winds converge at higher altitudes, causing air to descend and diverge near the surface, which suppresses rainfall.
- The descending air warms and dries, inhibiting cloud formation and precipitation.
Impact on Indian Monsoon:
- Positive Impact: When the MJO is over the Indian Ocean during the monsoon season, it can enhance rainfall over the Indian subcontinent, contributing to a more vigorous monsoon.
- Negative Impact: If the MJO cycle is prolonged and remains over the Pacific Ocean, it can adversely affect the Indian monsoon by reducing rainfall.
Global Climate Impact:
- Monsoon Systems: The timing and intensity of monsoon systems around the world can be influenced by the MJO, affecting agricultural patterns and water resources.
- Tropical Cyclones: The frequency and intensity of tropical cyclones in nearly all ocean basins are modulated by the MJO, impacting coastal regions and maritime activities.
- Weather Patterns in North America: The MJO can cause variations in the jet stream over the United States and other parts of North America, leading to extreme weather conditions such as outbreaks of cold air, periods of high heat, and flooding rains.
Indian Ocean Dipole (IOD)
The Indian Ocean Dipole (IOD) is a significant climatic phenomenon that affects weather patterns, not just in the Indian Ocean region but also across the globe. It involves complex interactions between the atmosphere and the ocean in the Indian Ocean, characterized mainly by the differential sea-surface temperatures (SSTs) between the western and eastern parts of the Indian Ocean, specifically between the Arabian Sea (western Indian Ocean) and the Bay of Bengal (eastern Indian Ocean). The IOD has a profound impact on the Indian monsoon, functioning alongside other global climatic phenomena like El Niño and La Niña. Understanding the IOD requires a look at its phases, each of which has distinct characteristics and implications for weather patterns.
Neutral Phase

- Characteristics: The Neutral Phase of the IOD is marked by the typical movement of water from the Pacific Ocean into the Indian Ocean through the Indonesian Throughflow, which occurs between the Indonesian islands. This movement keeps the sea-surface temperatures warmer to the northwest of Australia. The atmospheric circulation during this phase sees air rising above the warm waters northwest of Australia and descending across the western half of the Indian Ocean basin. This process results in the blowing of westerly winds along the equator.
- Implications: During the neutral phase, the weather patterns are generally considered to be in a state of equilibrium. The absence of significant temperature anomalies means that the impact on the monsoon can be neutral, without severe deviations from expected rainfall patterns.
Positive Phase
- Characteristics: The Positive Phase is characterized by a weakening of the westerly winds along the equator, which allows warm water to shift towards Africa. Concurrently, the altered wind patterns facilitate the upwelling of cooler waters from the deep ocean in the eastern Indian Ocean. This dynamic leads to a significant temperature gradient across the tropical Indian Ocean, with cooler-than-normal waters in the east (near Indonesia) and warmer-than-normal waters in the west (near Africa).
- Implications: Positive IOD events are generally beneficial for the Indian monsoon, enhancing rainfall during the monsoon season. The temperature difference across the Indian Ocean during this phase can lead to more vigorous monsoon winds and increased precipitation over the Indian subcontinent. Positive IOD events can sometimes coincide with El Niño events, though their impacts on the Indian monsoon can be independent or interrelated, depending on the strength and timing of each phenomenon.
Negative Phase

- Characteristics: In contrast, the Negative Phase sees an intensification of the westerly winds along the equator. This change leads to the accumulation of warmer waters near Australia (eastern Indian Ocean) and cooler waters near Africa (western Indian Ocean). The resultant temperature gradient is opposite to that observed during the Positive Phase, with warmer-than-normal waters in the east and cooler-than-normal waters in the west.
- Implications: The Negative Phase of the IOD tends to obstruct the Indian monsoon, often resulting in reduced rainfall and potential drought conditions in the Indian subcontinent. This phase is frequently associated with La Niña events, which can further amplify the negative impact on the monsoon rains due to the synergistic cooling effects of both phenomena in the central and eastern Pacific Ocean.
Development and Timing
- The IOD typically develops during April or May, with its effects becoming most pronounced around October. This timing is crucial as it overlaps with the onset and retreat of the Indian monsoon, thereby influencing its strength and distribution of rainfall.
Understanding the IOD and its phases is vital for predicting and preparing for the climatic changes it brings, especially in regions heavily dependent on monsoon rains for agriculture and water resources. The IOD’s influence extends beyond the Indian Ocean, affecting global weather patterns and emphasizing the interconnectedness of the Earth’s climate system.
Ocean Acidification
 Ocean Acidification refers to the process where the ocean becomes more acidic due to the absorption of carbon dioxide (CO2) from the atmosphere. Approximately one-third of the CO2 released by human activities ends up dissolved in the oceans. This interaction between seawater and CO2 leads to chemical changes that directly impact the ocean’s chemistry, primarily through the formation of carbonic acid. This acidification process results in a lower pH of seawater, indicating an increase in acidity.
Causes of Ocean Acidification
The primary cause of ocean acidification is the release of carbon dioxide from the combustion of fossil fuels, deforestation, and other human activities. When CO2 is absorbed by seawater, it reacts with water to form carbonic acid, which then dissociates into bicarbonate and hydrogen ions, leading to a reduction in pH levels.
Ocean Acidification in the Indian Ocean
- Arabian Sea: The Arabian Sea experiences high levels of acidification due to the excessive amounts of CO2 in the atmosphere. This increase in acidity poses significant threats to marine life and ecosystems.
- Bay of Bengal: Acidification in the Bay of Bengal is largely attributed to pollutants from the Indo-Gangetic plains mixing with seawater. During the winter, winds from the land carry pollutants across to the sea, further exacerbating the acidification process.
Impact of Ocean Acidification
| Impact Type | Positive Effects | Negative Effects |
| Ecological | Some species of algae and seagrass may benefit from higher CO2 concentrations, potentially leading to increased photosynthesis and growth rates. | Coral reefs are particularly vulnerable to ocean acidification, which can hinder their growth and lead to their destruction. This, in turn, affects the myriad of species that depend on coral reefs for habitat. |
| Biodiversity | The destruction of coral reefs occurs at a rate faster than their ability to regenerate, posing a significant threat to biodiversity. | |
| Atmospheric Interactions | Ocean acidification can adversely affect cloud formation and seeding processes, potentially impacting climate patterns and weather systems. |
Water Resources: An In-depth Analysis
Water is the most essential resource for life on Earth. It covers approximately 71% of the Earth’s surface, yet the paradox of water abundance versus availability is stark. Despite its vast coverage, fresh water, which is crucial for human consumption, agriculture, and industry, constitutes only about 3% of the total water on Earth. This disparity underscores the challenges of water resource management and the need for sustainable practices.
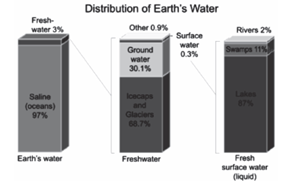
Global Context and India’s Position
Globally, water distribution is uneven, and the situation in India provides a compelling case study of the challenges and opportunities in water resource management. India, with 2.45% of the world’s land area, holds about 4% of the world’s water resources but supports approximately 16% of the global population. This disproportion highlights the pressure on India’s water resources, making efficient management and sustainable practices critical.
Precipitation and Utilizable Water Resources
India receives about 4,000 cubic kilometers of water annually through precipitation. However, only a fraction of this, approximately 60%, is deemed utilizable for various needs such as agriculture, domestic consumption, and industrial use. This brings the total utilizable water resource in India to 1,122 cubic kilometers. The limitation in harnessing the full potential of precipitation underscores the need for improved water harvesting and management techniques.
Agriculture: The Primary Consumer
Agriculture is the largest consumer of water in India, accounting for about 90% of total consumption. The preference for water-intensive crops like rice, wheat, and sugarcane exacerbates the water scarcity problem. These crops consume 80% of irrigation resources, indicating a significant imbalance in water use efficiency. The agricultural sector’s reliance on both surface and groundwater is profound, with agriculture accounting for 89% of surface water and 92% of groundwater utilization.
Challenges and Solutions
The current state of water resource utilization in India highlights several challenges:
1.Overdependence on Monsoon: India’s agriculture and water supply heavily depend on the monsoon season, making the country vulnerable to any changes in precipitation patterns due to climate change.
2. Inefficient Water Use: The high consumption of water in agriculture, especially for water-intensive crops, indicates inefficiencies in water use and the need for adopting more water-efficient crops and irrigation methods.
3. Groundwater Depletion: Excessive extraction of groundwater for agriculture has led to a decline in groundwater levels, threatening water security for future generations.
To address these challenges, several solutions can be proposed:
1.Water Harvesting and Storage: Enhancing water harvesting and storage capabilities can mitigate the impact of variable monsoon patterns and ensure a more stable water supply.
2. Crop Diversification: Encouraging crop diversification away from water-intensive crops to more water-efficient crops can significantly reduce water consumption.
3.Irrigation Efficiency: Adopting modern irrigation techniques such as drip and sprinkler irrigation can improve water use efficiency in agriculture.
4. Public Awareness and Policy: Raising public awareness about water conservation and implementing policies that promote water-saving practices are essential steps towards sustainable water management.
Detailed Analysis of Water Usage in India
Water usage in India is categorized across various sectors, with a significant disparity in the share each sector consumes. This distribution highlights the critical challenges and areas for intervention in managing and conserving water resources in the country.
Domestic Sector Water Usage
- Surface Water vs. Groundwater Utilization: The domestic sector shows a higher reliance on surface water, utilizing 9% of it compared to its utilization of groundwater. This indicates a preference or necessity to tap into rivers, lakes, and reservoirs for meeting domestic water needs, which could be due to the accessibility or quality of water from these sources.
Industrial Sector Water Usage
- Limited Share in Water Utilization: The industrial sector’s consumption of water resources is relatively low, accounting for only 2% of surface water and 5% of groundwater utilization. This limited share suggests either a lower water demand in industrial processes or the implementation of water-efficient technologies within this sector. However, the specific needs and impacts of the industrial sector on local water resources can vary significantly across regions and types of industries.
Agricultural Sector Water Usage
- Dominant Consumer of Water Resources: Agriculture is by far the most significant consumer of water in India, accounting for 89% of surface water and 92% of groundwater utilization. This immense consumption underscores the sector’s reliance on water for irrigation, especially for water-intensive crops, which poses sustainability challenges considering the finite nature of water resources.
Surface Water Resources
- Utilization Challenges: Of the available surface water in India, only about 690 cubic kilometers, or 37%, can be effectively utilized. This limitation is due to the temporal distribution of water flow, especially from the Himalayan rivers, which see over 90% of their annual flow occurring over a four-month period. The potential for capturing and storing this water is hindered by the lack of suitable reservoir sites, making it a significant challenge to manage and utilize surface water resources efficiently.
Groundwater Resources
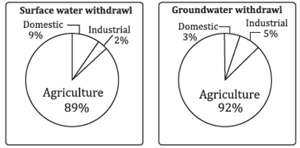
- Replenishable Resources and Utilization: India has about 432 cubic kilometers of replenishable groundwater resources, making it the largest user of groundwater in the world. A significant portion of these resources is found in the Ganga and the Brahmaputra basins, which account for about 46% of the country’s total replenishable groundwater.
- Regional Variations in Utilization: Groundwater utilization is particularly high in the northwestern regions and parts of South India. States like Punjab, Haryana, Rajasthan, and Tamil Nadu exhibit very high levels of groundwater extraction, reflecting the intense agricultural activities and the pressure on groundwater resources in these areas.
Challenges and Potential Solutions
The distribution of water usage among different sectors and the challenges in managing surface and groundwater resources highlight several key issues:
1.Sustainable Agriculture Practices: Given agriculture’s dominant share in water consumption, there is a pressing need for sustainable irrigation practices, crop diversification away from water-intensive crops, and the adoption of water-efficient technologies.
2. Enhancing Water Storage: Addressing the challenge of capturing and storing surface water requires investment in infrastructure development, such as reservoirs and dams, especially in areas prone to significant seasonal variations in water availability.
3. Groundwater Management: The over-extraction of groundwater in certain regions necessitates the implementation of stringent groundwater management policies, recharge initiatives, and the promotion of water-saving technologies.
4. Sector-Specific Water Efficiency: Across all sectors, there is a need for policies and practices that encourage water efficiency. For the industrial sector, this might mean adopting recycling and reuse practices, while for domestic use, it involves water conservation measures and awareness campaigns.
Oceanic Resources
Economic Importance of Oceanic Resources Oceanic resources contribute significantly to the global economy through:
- Seafood Production: Fisheries and aquaculture provide a primary source of protein to billions of people and are a livelihood for millions worldwide. The exponential increase in fish harvests illustrates the ocean’s role in food security.
- Energy Resources: The ocean floor harbors vast reserves of oil, gas, and minerals critical for various industries. Renewable energy sources, such as tidal and wave energy, offer untapped potential for sustainable power generation.
- Tourism and Recreation: Coastal and marine tourism, including activities like diving, fishing, and sailing, is a significant economic driver for many regions, contributing to job creation and cultural exchange.
Environmental Significance
The environmental importance of oceanic resources encompasses:
- Climate Regulation: Oceans act as a carbon sink, absorbing a significant portion of the carbon dioxide emitted into the atmosphere, thereby mitigating the impacts of climate change.
- Biodiversity: Marine ecosystems are home to a diverse range of species, many of which are not yet discovered. These ecosystems play critical roles in maintaining ecological balance and supporting marine food webs.
- Oxygen Production: Phytoplankton, tiny plant-like organisms in the ocean, produce a substantial portion of the Earth’s oxygen through photosynthesis, highlighting the integral role of oceans in sustaining life on the planet.
Challenges to Oceanic Resources
Despite their importance, oceanic resources face numerous threats, including:
- Overfishing: Excessive fishing practices have led to the depletion of fish stocks, threatening food security and marine biodiversity.
- Pollution: Plastic waste, oil spills, and chemical runoff from agriculture and industry severely impact marine life and ecosystems.
- Climate Change: Rising sea temperatures, ocean acidification, and sea-level rise pose significant risks to marine biodiversity and the health of oceanic resources.
Sustainable Management and Conservation Strategies
To ensure the sustainable use of oceanic resources, a multifaceted approach is necessary:
- Sustainable Fishing Practices: Implementing quotas, protected areas, and sustainable fishing techniques can help restore and maintain fish populations.
- Marine Protected Areas (MPAs): Establishing MPAs can protect habitats and biodiversity, allowing ecosystems to recover and flourish.
- Pollution Reduction: Reducing plastic use, improving waste management, and controlling agricultural runoff are critical to preventing ocean pollution.
- Renewable Energy: Investing in and transitioning to renewable ocean energy sources can reduce dependence on fossil fuels and mitigate climate change impacts.
- International Cooperation: Global challenges require global solutions. International agreements and cooperation are essential for the effective management and conservation of oceanic resources.
Prospect of Blue Economy
The concept of the Blue Economy has gained considerable attention as a framework for fostering sustainable economic growth, leveraging the vast resources of the world’s oceans and waterways. This model emphasizes environmental sustainability, innovation, and socio-economic benefits, closely aligning with global efforts to address climate change, biodiversity loss, and socio-economic disparities.
Introduction to the Blue Economy
The term “Blue Economy” was popularized by Dr. Gunter Pauli in his seminal work, “The Blue Economy: 10 years, 100 innovations, 100 million jobs,” which outlines a development model that harnesses the potential of the ocean and coastal areas to generate economic growth, while ensuring the health and sustainability of the ocean’s ecosystems. The Blue Economy encompasses a broad range of activities, including renewable energy, fisheries, maritime transport, tourism, and waste management, among others.
Core Principles: At its core, the Blue Economy advocates for:
- Sustainable use of ocean resources for economic growth, improved livelihoods, and jobs while preserving the health of ocean ecosystems.
- Innovative approaches to address resource scarcity through the development and deployment of new technologies that minimize environmental impact.
- Integration of local resources and renewable inputs in economic planning and development strategies, promoting resilience and reducing dependency on imported goods and services.
Potential Benefits
- Economic Growth and Job Creation: The sustainable management of ocean resources has the potential to spur economic growth and create millions of jobs worldwide, particularly in sectors such as sustainable fisheries, aquaculture, coastal and maritime tourism, and marine biotechnology.
- Environmental Sustainability: By emphasizing renewable resources and minimizing waste, the Blue Economy seeks to reduce environmental risks and ecological challenges, including pollution, overfishing, and the degradation of marine habitats.
- Climate Change Mitigation and Adaptation: The Blue Economy plays a crucial role in mitigating climate change by promoting the development and use of renewable energy sources such as wind, wave, and tidal energy. Additionally, the protection and restoration of marine and coastal ecosystems, such as mangroves and coral reefs, contribute to carbon sequestration and enhance resilience to climate change impacts.
- Socio-economic Development: The focus on equitable access to resources and benefits ensures that the Blue Economy contributes to the socio-economic development of coastal communities, improving livelihoods, food security, and access to sustainable energy.
Challenges and Considerations
- Governance and Regulation: Effective governance frameworks and international cooperation are essential to manage the shared resources of the world’s oceans and to address cross-border environmental issues.
- Sustainable Practices and Innovation: Balancing economic development with environmental sustainability requires ongoing innovation and the adoption of best practices in marine resource management.
- Equity and Inclusion: Ensuring that the benefits of the Blue Economy are distributed equitably requires policies that prioritize the needs of vulnerable communities and promote inclusive economic development.
- Investment and Infrastructure: Developing the Blue Economy infrastructure, such as ports, renewable energy installations, and sustainable aquaculture facilities, requires significant investment and capacity building.
Potential of Blue Economy in India
India, with its extensive coastline and strategic location in the Indian Ocean, holds significant potential to leverage the Blue Economy for sustainable development and economic growth. The Blue Economy can not only contribute to India’s GDP but also play a pivotal role in achieving broader economic, social, and environmental objectives.
Fisheries and Aquaculture
- India’s fisheries and aquaculture sectors are vital components of the Blue Economy, providing employment to millions and contributing to food security. The Indian Ocean Region (IOR) is rich in marine biodiversity, offering substantial opportunities for sustainable fish farming and capture fisheries. Enhancing sustainable practices, investing in aquaculture technology, and improving value chains can significantly increase productivity and economic returns from these sectors.
Ocean Energy
- The potential for ocean energy in India, including tidal, wave, and thermal energy, remains largely untapped. Harnessing these renewable energy sources could significantly contribute to India’s energy mix, reducing dependency on fossil fuels and enhancing energy security. Research and development in ocean energy technologies tailored to Indian Ocean conditions are crucial for exploiting this potential.
Seabed Mining
- India’s exclusive rights for the exploration of polymetallic nodules in the Central Indian Ocean Basin highlight the country’s potential in seabed mining. These nodules contain valuable minerals like nickel, cobalt, iron, and manganese, essential for various industries, including electronics and renewable energy technologies. Developing sustainable seabed mining techniques will be key to exploiting these resources without harming marine ecosystems.
Marine Tourism and Shipping
- Marine tourism, including coastal tourism, cruises, and water sports, presents significant economic opportunities for India, leveraging its beautiful coastlines and islands. Moreover, as a major player in global shipping, India can further develop its ports and shipping industries, enhancing efficiency and sustainability through investments in green port infrastructure and clean shipping technologies.
Research, Development, and Innovation
- Advancements in marine biology, biotechnology, and oceanography can open new avenues for the Blue Economy in India. Investing in research and development can lead to innovations in sustainable fisheries, bioactive compounds from marine organisms, and environmental monitoring, among others.
Strategic Importance and Security
- The Indian Ocean Region’s strategic importance for India’s economic growth cannot be overstated, especially considering the country’s reliance on sea routes for the bulk of its trade, including oil and gas imports. A robust Blue Economy can enhance maritime security, safeguarding these vital trade routes.
Moving Forward
For India to fully realize the potential of its Blue Economy, a multi-faceted approach is necessary:
- Policy and Governance: Implement comprehensive policies that promote sustainable practices across all Blue Economy sectors.
- Infrastructure Development: Invest in modernizing fishing harbors, upgrading port facilities, and developing coastal infrastructure to support marine tourism and renewable energy.
- Capacity Building: Strengthen human capital in maritime sectors through education, training, and research initiatives.
- International Collaboration: Engage in partnerships for technology exchange, joint research, and best practices in sustainable ocean management.
Ocean sediments
Ocean sediments are an integral part of understanding marine environments and the geological processes that shape our planet.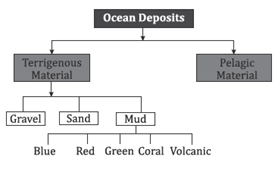 Understanding Rock Exposure and Sediment Transport
The journey of sediments from their origin to their final resting place in the ocean involves several stages:
1.Exposure of Rocks: The exposure of rocks at the Earth’s surface is a fundamental process. Through weathering (both physical and chemical) and erosion, rocks are broken down into smaller pieces. This process is influenced by various factors including climate, topography, and the type of rock.
2. Transportation: Once the rocks are broken down into smaller particles, these sediments are transported to the ocean via rivers, wind, and even glaciers. The method and distance of transportation depend on the size and weight of the sediment particles, as well as the energy of the transporting medium (e.g., water flow speed, wind strength).
3. Volcanic Contributions: Apart from weathering and erosion, volcanic eruptions are another significant source of oceanic sediments. Ash and other materials ejected during eruptions can be transported by wind and water currents into the ocean.
4. Biogenic Sediments: The decomposition of marine organisms, including both plants and animals, contributes organic sediments to ocean deposits. These biogenic sediments are a critical component of marine ecosystems and play a role in the carbon cycle.
Terrigenous Material
Terrigenous sediments originate from land and are transported to the ocean. They primarily consist of igneous, sedimentary, or metamorphic rocks that have been broken down through the processes of disintegration and decomposition.
- Gravel: Gravel consists of coarse materials ranging from boulders to granules. They are typically found close to the shore, forming pebble banks, and are generally too heavy to be transported far into the ocean.
- Sand: Sand deposits contain fragments of various rock types, thoroughly mixed. Quartz is a common component due to its abundance and resistance to weathering. Sand’s grain size can vary, affecting its transport and deposition.
- Silt, Clay, and Muds: These finer particles are transported further from the shore. Clays, finer than muds, act as a binding agent for sediments. Their origin is often from the disintegration of continental rocks, transported into the sea by rivers as suspended particles. Muds, finer than sands, consist mainly of minute rock-forming minerals, with quartz being predominant.
Factors Influencing Sediment Distribution
The distribution and composition of oceanic sediments are influenced by several factors:
- Distance from Land: The type and size of sediment particles found in ocean deposits change with distance from the land. Larger, heavier particles settle closer to the shore, while finer particles are carried further out to sea.
- Ocean Currents and Waves: The strength and direction of ocean currents and waves play a significant role in transporting and depositing sediments. They can carry sediments over vast distances and shape the seabed through deposition and erosion processes.
- Biological Activity: The contribution of biogenic sediments is influenced by the productivity of marine ecosystems, which can vary widely across different ocean regions.
Understanding ocean sediments is crucial for unraveling the Earth’s geological history, assessing marine biodiversity, and evaluating environmental changes. The study of marine deposits not only provides insights into past climates and tectonic movements but also helps in predicting future environmental shifts.
Pelagic Deposits
Pelagic deposits are a mix of organic and inorganic materials found in deep-sea environments such as the continental slope, rise, trenches, and abyssal plains. These deposits play a significant role in the ocean’s chemical and biological processes.
Mineral Deposits in Oceanic Environments
| Category | Minerals and Characteristics |
| Mineral dissolved in seawater | Salt, Bromine, Magnesium, Gold, Zinc, Uranium, Thorium, etc. |
| Continental shelf and slope deposit | Sulfur (associated with marine volcanism, e.g., Gulf of Mexico – a rich source of sulfur) |
| Deep ocean bottom deposit | · Manganese nodules (contain nickel, copper, cobalt, lead, zinc, with high percentages of Iron and Manganese)
· Cobalt-rich crusts (associated with seamounts and guyots) · Phosphorites (phosphoric nodules on shallow seabeds) · Polymetallic nodules (rounded accretions of manganese and iron hydroxides, abundant on abyssal plains) |
Energy Resources
| Type | Resources |
| Renewable | OTEC (Ocean Thermal Energy Conversion), Wind, Tidal, Wave |
| Non-Renewable | Gas Hydrates, Mineral Resources, Natural Gas |
- Renewable Energy Resources: These are energy sources that are replenished naturally and are considered sustainable. OTEC, wind, tidal, and wave energies harness the ocean’s natural thermal gradients, movements, and currents to generate power.
- Non-Renewable Energy Resources: These include gas hydrates, mineral resources, and natural gas, which are finite and extracted from the ocean floor. Gas hydrates, in particular, represent a potential future energy source but with challenges related to extraction and environmental impacts.
United Nations Convention on The Law of The Sea (UNCLOS)
The United Nations Convention on the Law of the Sea (UNCLOS), also known as the Law of the Sea Convention or the Law of the Sea Treaty, is a landmark international agreement that establishes a comprehensive framework governing the rights and responsibilities of nations in their use of the world’s oceans. It aims to facilitate international communication, promote peaceful uses of the seas, support efficient navigation and transportation, and ensure the conservation and equitable utilization of oceanic resources.
Background and Formation
- Historical Context: Before UNCLOS, the principle of “freedom of the seas” dominated, limiting national rights to a narrow belt of sea up to 3 nautical miles off a state’s coast. This concept, rooted in the 17th century, was deemed inadequate for addressing the complexities and technological advancements of the 20th century.
- Development Process: The convention emerged from the United Nations Conference on the Law of the Sea (UNCLOS III), which took place from 1973 to 1982. This extensive negotiation process was aimed at creating a universally accepted legal framework for the sea.
- Adoption and Implementation: UNCLOS was officially concluded in 1982 and came into effect in 1994, after meeting the threshold of ratifications needed. It replaced the 1958 quad-treaty Convention on the High Seas. As of 2016, it had 167 country signatories and the European Union.
Key Features of UNCLOS
- Exclusive Economic Zone (EEZ): UNCLOS grants coastal nations rights over an EEZ extending 200 nautical miles from their shoreline. Within this zone, the coastal nation has exclusive rights to explore and exploit marine resources, both living and non-living.
- Territorial Sea and Contiguous Zone: Nations have sovereignty over their territorial sea, up to 12 nautical miles from their baseline. The contiguous zone extends a further 12 miles, where a state can enforce laws concerning customs, immigration, and pollution.
- Continental Shelf: UNCLOS defines the continental shelf of a coastal nation, extending up to 200 nautical miles or beyond, subject to specific geological criteria. Nations have exclusive rights to resources on or below the seabed.
- High Seas: Beyond national jurisdiction, the high seas are open to all states for navigation, overflight, fishing, and scientific research, under conditions of freedom and consideration of others’ rights.
- Deep Seabed Mining: UNCLOS establishes the International Seabed Authority (ISA) to regulate mineral resource activities in the international seabed area, ensuring that the deep sea bed’s resources are utilized in a manner that benefits humanity as a whole.
Associated Organizations
- International Maritime Organization (IMO): While not created by UNCLOS, the IMO plays a critical role in implementing many of its provisions, especially those related to shipping safety, marine pollution, and legal matters.
- International Seabed Authority (ISA): Directly established by UNCLOS, the ISA manages mineral-related activities in the international seabed area, ensuring they are environmentally sustainable and benefit mankind.
- International Whaling Commission (IWC): Although it operates under its own convention, the IWC works in tandem with UNCLOS principles, particularly in the conservation of whale species and the management of whaling.
Significance and Challenges
UNCLOS represents a monumental effort to govern the world’s oceans through a legal order that respects the interests of both coastal and land-locked states while promoting the peaceful use of the seas, the equitable and efficient utilization of their resources, and the conservation of marine life. However, the convention also faces challenges, including disputes over territorial claims, enforcement of its provisions, and the need for adaptation to emerging issues like climate change and marine biodiversity beyond national jurisdiction.
Foundational Treaties from the First UNCLOS Conference (1956)
- Convention on the Territorial Sea and Contiguous Zone: This treaty defines the limits of a country’s territorial sea and its contiguous zone. It establishes the sovereignty a coastal state exercises over its territorial sea, up to a limit not exceeding 12 nautical miles from its baseline, and the rights it has in the contiguous zone, up to 24 nautical miles from its baseline, especially for the enforcement of customs, fiscal, immigration, and sanitary laws.
- Convention on Fishing and Conservation of Living Resources of the High Seas: This treaty focuses on the conservation and management of marine living resources on the high seas. It acknowledges the freedom of fishing on the high seas but also emphasizes the responsibility of states to conserve living resources, preventing over-exploitation.
- Convention on the High Seas: This treaty delineates the rights and freedoms of states on the high seas, including navigation, fishing, laying submarine cables and pipelines, and overflight. It also addresses issues like piracy, the slave trade, and unauthorized broadcasting, asserting that the high seas are open to all states, whether coastal or land-locked.
- Convention on the Continental Shelf: This treaty grants coastal states the right to exploit the natural resources of the seabed and subsoil of the continental shelf extending beyond their territorial sea to the outer edge of the continental margin, or up to 200 nautical miles from the baselines where the outer edge does not extend up to that distance.
Subsequent Initiatives after the Establishment of UNCLOS
After the formal establishment of UNCLOS in 1982, several initiatives have been undertaken to enhance and clarify the framework set by the convention. These include:
- Exclusive Economic Zone (EEZ): UNCLOS established the concept of the Exclusive Economic Zone, allowing coastal states sovereign rights over the exploration and use of marine resources within 200 nautical miles of their shoreline, beyond their territorial sea.
- Deep Seabed Mining: UNCLOS introduced a legal regime for the mining of mineral resources in the deep seabed area beyond national jurisdiction, requiring states to minimize environmental impacts and share the benefits of seabed mining.
- Marine Environmental Protection: The convention includes comprehensive provisions aimed at the prevention and reduction of pollution from various sources, including vessels, land-based sources, and seabed activities. It also promotes the protection and preservation of the marine environment.
- Dispute Resolution Mechanisms: UNCLOS provides for various dispute resolution mechanisms, including the International Tribunal for the Law of the Sea (ITLOS), the International Court of Justice (ICJ), and arbitration tribunals, to ensure the peaceful settlement of disputes arising from maritime issues.
- Maritime Safety and Security: The convention includes measures aimed at ensuring maritime safety and security, addressing issues such as piracy, illegal, unreported, and unregulated (IUU) fishing, and maritime terrorism.
| Organization | Establishment Date | Purpose |
| International Tribunal for the Law of the Sea (ITLOS) | December 10, 1982 (Entered into force on November 16, 1994) | An independent judicial body established by UNCLOS to adjudicate disputes arising from the convention. |
| International Seabed Authority (ISA) | 1994 | Formed to regulate the exploration and exploitation of marine non-living resources of oceans in international waters. |
| Commission on the Limits of the Continental Shelf (CLCS) | Under UNCLOS (Date not specified) | Responsible for facilitating the implementation of UNCLOS with respect to the establishment of the outer limits of the continental shelf beyond 200 nautical miles. |
UNCLOS and India
India’s engagement with the United Nations Convention on the Law of the Sea (UNCLOS) is multifaceted and reflects the country’s strategic interests in both its immediate maritime neighborhood and the broader international waters. The following sections provide a detailed overview of India’s involvement with UNCLOS, its implications for maritime jurisdiction and resource exploitation, and India’s maritime boundaries with neighboring countries.
India’s Role and Participation in UNCLOS
- Historical Engagement: India was actively involved in the deliberations that led to the adoption of UNCLOS in 1982, demonstrating its commitment to a regulated and legal framework for the world’s oceans and seas. India formally became a party to UNCLOS in 1995, aligning its maritime laws and practices with international standards.
- Strategic Implications: India’s adherence to UNCLOS underpins its legal basis for the exclusive jurisdiction over the commercial exploitation of resources on its continental shelf. This includes the rights to metallic ore, non-metallic ore, and hydrocarbon extractions. The strategic management of these rights is crucial for safeguarding India’s maritime boundaries and leveraging the potential economic benefits from its marine resources.
Resource Exploration and Exploitation
- Investment in Deep-Sea Exploration: India has prioritized the exploration of non-living resources in international waters, focusing on polymetallic nodules, cobalt crusts, and hydrothermal sulfides. These efforts are part of India’s broader strategy to secure access to essential minerals and resources critical for its economic development.
- Hydrocarbon Exploration: The global trend of discovering hydrocarbon resources in deeper parts of the continental shelf has prompted India to intensify its exploration activities. These efforts aim to enhance India’s energy security by tapping into new and untapped hydrocarbon reserves.
Maritime Boundaries and Regional Relations
- Neighboring Countries: India shares its maritime boundaries with Bangladesh, Indonesia, Myanmar, Sri Lanka, Thailand, Maldives, and Pakistan. The delineation and management of these boundaries are pivotal for regional cooperation, conflict resolution, and the exploitation of shared resources.
- Collaboration and Dispute Resolution: Through UNCLOS mechanisms, India engages in negotiations and collaborative efforts with its neighbors to establish clearly defined maritime boundaries. This process is essential for peaceful coexistence, enhancing regional maritime security, and facilitating the joint exploration and management of marine resources.
Maritime Zones

| Maritime Zone | Details |
| Baseline | Defined as the low-water line along the coast, officially recognized by the coastal state. It serves as the reference point for measuring the extent of other maritime zones. |
| Internal Waters | Includes all water and waterways on the landward side of the baseline, such as bays, ports, inlets, rivers, and lakes connected to the sea. The coastal state exercises full sovereignty over its internal waters, similar to its land territory, including the right to regulate access and use. There is no right of innocent passage for foreign vessels, meaning they must obtain permission to enter these waters. |
| Territorial Sea | Extends up to 12 nautical miles from the baseline. The coastal state has sovereignty over the air space above the sea, the sea itself, and the sea bed and subsoil. Foreign ships (both military and civilian) are allowed innocent passage through the territorial sea, provided it is not prejudicial to the peace, good order, or security of the coastal state. Submarine and underwater vehicles are required to navigate on the surface and show their flag. |
| Contiguous Zone | Extends from the outer edge of the territorial sea up to 24 nautical miles from the baseline. In this zone, the coastal state has the power to enforce laws concerning customs, fiscal, immigration, and sanitary matters. This means the state can take action to prevent infringement of its laws within its territory or territorial sea, or to punish those infringements. However, this zone does not grant the coastal state rights over air space. |
| Exclusive Economic Zone (EEZ) | Stretches up to 200 nautical miles from the baseline. Within this zone, the coastal state has sovereign rights for the purpose of exploring, exploiting, conserving, and managing natural resources, both living and non-living, of the waters superjacent to the seabed and of the seabed and its subsoil. Additionally, the state has rights to activities related to the production of energy from the water, currents, and winds. Other states have freedom of navigation and overflight, as well as the freedom to lay submarine cables and pipelines, subject to certain conditions. |
| High Seas | Areas beyond the EEZ, not under the jurisdiction of any state, are considered the common heritage of mankind. Freedom of the high seas is open to all states, whether coastal or land-locked, for various peaceful purposes, including navigation, overflight, fishing, scientific research, and undersea exploration. States are also bound to cooperate in the conservation and management of living resources. |
UPSC PREVIOUS YEAR QUESTIONS
1. What would happen if phytoplankton of an ocean is completely destroyed for some reason? (2012)
1. The ocean as a carbon sink would be adversely affected.
2. The food chains in the ocean would be adversely affected.
3. The density of ocean water would drastically decrease.
Select the correct answer using the codes given below:
(a) 1 and 2 only (b) 2 only
(c) 3 only (d) 1, 2 and 3
2. Consider the following kinds of organisms: (2021)
1. Copepods 2. Cyanobacteria
3. Diatoms 4. Foraminifera
Which of the above are primary producers in the food chains of oceans?
(a) 1 and 2 (b) 2 and 3
(c) 3 and 4 (d) 1 and 4
3. Which of the following statements best describes “carbon fertilization”? (2018)
(a) Increased plant growth due to increased concentration of carbon dioxide in the atmosphere
(b) Increased temperature of Earth due to increased concentration of carbon dioxide in the atmosphere
(c) Increased acidity of oceans as a result of increased concentration of carbon dioxide in the atmosphere
(d) Adaptation of all living beings on Earth to the climate change brought about by the increased concentration of carbon dioxide in the atmosphere
4. What is blue carbon? (2021)
(a) Carbon captured by oceans and coastal ecosystems
(b) Carbon sequestered in forest biomass and agricultural soils
(c) Carbon contained in petroleum and natural gas.
(d) Carbon present in atmosphere