
Stagnance in Structural Transformation
Context: Two recent sets of data released by the National Sample Survey Office (NSSO) and the National Statistical Office (NSO) provide insights into the process of structural transformation in the Indian economy, especially in relation to the agriculture and manufacturing sectors.
What is structural transformation?
- Structural transformation as fundamentally a compositional shift that entails the transfer of surplus labour from agriculture to sectors where productivity (output per worker) and average incomes are higher — particularly manufacturing and modern services.
- The NSSO’s latest annual Periodic Labour Force Survey (PLFS) report for 2021-22 (July-June) shows the farm sector’s share in the country’s employed labour force at 45.5%.
- It is down from 46.5% in 2020-21, but still higher than the 2018-19 low of 42.5%.
- The main reason behind it seems to be the effects of the pandemic-induced economic disruptions, which had forced a reverse migration to the farms, haven’t fully subsided.
Structural transformation post LPG reforms
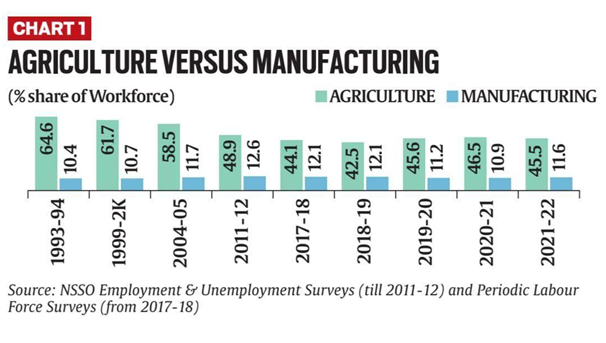
- The biggest decline, from 58.5% to 48.9%, happened between 2004-05 and 2011-12.
- During this seven-year period, the workforce engaged in farming registered, for the first time in India’s history, a fall even in absolute terms — from 268.6 million to 231.9 million.
- The share of the labour force employed in manufacturing too, peaked at 6% in 2011-12.
- Since 2011-12, this structural transformation has slowed, with the share of agriculture in employment not falling fast enough and even rising after 2018-19.
- The share of manufacturing has dropped behind even that of construction and trade, hotels & restaurants.
- It seems that the structural transformation hasn’t just slowed but has stalled, if not reversed.
- There is not much labour transfer taking place from farms to factories.
- The jobs that are getting generated outside agriculture are mostly in construction and low-paid services, whose share has overtaken that of manufacturing.
- The construction sector has now become the second-largest employer after agriculture.
- Five years ago, it was at No. 4, after agriculture, manufacturing and trade, hotels & restaurants. Now, manufacturing has been relegated to the fourth spot.
Estimates of Ouput and Value added
- Output is simply the gross value of production by an industry or sector.
- For the economy, it would mean the total value of all goods and services produced during a financial year.
- However, production involves the use of inputs. Further, the inputs for one industry are the outputs of other industries supplying to it.
- To avoid double-counting, one has to, then, deduct the value of inputs or intermediate consumption from the value of output.
- Since the producer merely adds value to the inputs that he uses, economists consider gross value added (GVA), and not gross value of output (GVO), as a measure of aggregate production.
- One way to assess how much value an industry or sector actually creates in the process of production is by looking at the ratio of GVA to GVO.
- GVA is GVO at current prices minus the value of intermediate consumption.
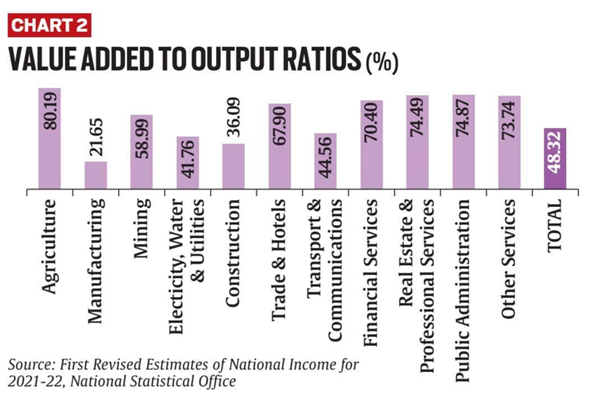
- It can be seen that value addition is the highest in agriculture.
- For every Rs 100 worth of produce coming from Indian farms, Rs 80 is the value generated by those owning and working the lands.
- In 2021-22, the GVO from agriculture, forestry & fishing was estimated at Rs 50.71 lakh crore.
- After deducting the value of intermediate consumption (Rs 10.05 lakh crore), the GVA for the sector worked out to Rs 40.66 lakh crore.
- On the other hand, value addition is the lowest, at just over a fifth, for manufacturing.
- Although the GVO from manufacturing (Rs 156.90 lakh crore) was more than three times from agriculture, the value of intermediate consumption, too, was over 12 times (Rs 122.93 crore) higher.
- As a result, the GVA by manufacturing, at Rs 33.97 lakh crore in 2021-22, was way below agriculture’s.
- Purchased inputs are very little in agriculture, unlike manufacturing. The value produced comes mostly from the land rather than the seeds, fertilisers, pesticides, diesel and electricity that farmers consume.
Does it have any link with the employment data
- High value-addition is a key reason why agriculture is able to employ so many people.
- The sector’s share in GVO — the total value of all goods and services produced by the country — was only 11.4% in 2021-22.
- When measured in terms of value-added or GVA though, the share rose to 19%.
- It was the other way round for manufacturing: its share in overall GVO was as high as 4%, while being just 15.8% relative to GVA.
- However, even taking into account high value-addition, a sector generating 19% of income — accruing to the primary factors of production, namely the owners of land (farmers), labour (agricultural workers) and capital (lenders) — cannot support 45% of the country’s population.
- Moreover, the GVA-GVO ratio is not a measure of productivity.
- An agriculturalist may be adding more value to every unit of input he consumes than a manufacturer.
- But productivity is a function of output per worker or per unit of land — which is low in agriculture compared to modern manufacturing and services.
- It explains why the average farmer earns less than his urban counterpart. To earn more, the farmer’s productivity has to go up — which means producing more on the same land with fewer hands.
| Practice Question
1. What is the conception of Missing Middle? Why has the structural Transformation of the Indian economy stalled in recent times? |