WHAT EC MUST GUARANTEE
SYLLABUS:
GS 2:
- Role of women and women’s organization, population and associated issues, poverty and developmental issues, urbanization, their problems and their remedies.
Focus:
- THE RELEASE OF the factsheet of the Household Consumption Expenditure Survey (HCES) has sparked a flurry of activ-ity
 Source: Hindu
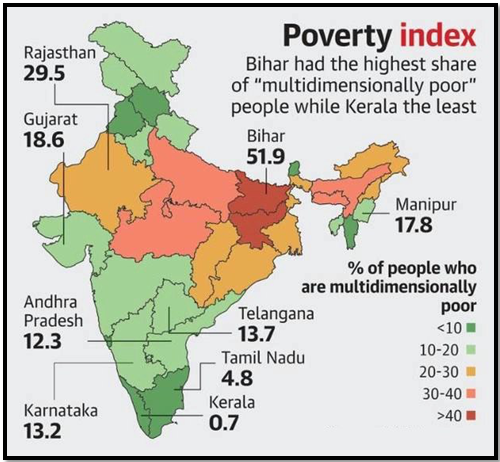
According to World Bank, Poverty is pronounced deprivation in well-being, and comprises many dimensions. It includes low incomes and the inability to acquire the basic goods and services necessary for survival with dignity. Poverty also encompasses low levels of health and education, poor access to clean water and sanitation, inadequate physical security, lack of voice, and insufficient capacity and opportunity to better one’s life.
Introduction to Household Consumption Expenditure Survey (HCES)
- Release of HCES Factsheet: The publication of the HCES factsheet has ignited extensive discussions on poverty trends and the effectiveness of government policies under different administrations.
- Focus of Debate: The central issue revolves around the rate of poverty reduction and whether it has been more substantial under the National Democratic Alliance (NDA) or the United Progressive Alliance (UPA).
- Data Collection Variability: Differences in poverty estimates often arise from variations in the reference periods used for data collection, the defined poverty line, and the price index applied.
- Historical Reference Periods: Originally employing a 30-day recall period for data collection, the National Sample Survey Office (NSSO) expanded its methodology in 1983 to include a 365-day recall for durable goods.
- Evolution of Reference Periods: By the 1990s, discrepancies between NSS aggregate consumption and national accounts prompted the introduction of a seven-day reference period, culminating in the adoption of the modified mixed reference period (MMRP) in 2011-12.
Methodological Changes and Their Implications
- Initial Poverty Estimates: Up until 2004-05, poverty estimates were calculated using data from the Uniform Reference Period (URP), based on the Lakdawala Committee’s guidelines which were tied to calorie intake.
- Shift from Calorie-Based Benchmarks: Growing dissatisfaction with the calorie intake model led the Tendulkar Committee to recommend a departure from this norm, questioning its correlation with health outcomes.
- Adoption of MMRP: The Tendulkar Committee suggested that future poverty lines should be adjusted according to the MMRP to account for improved consumption reporting.
- Rangarajan Committee Recommendations: In 2012, a further refinement was proposed by the Rangarajan Committee, suggesting poverty lines based on normative levels of essential needs and other non-food expenses.
- Updated Poverty Rates: Using the MMRP-based data, the Planning Commission’s later reports indicated lower poverty rates, although no official estimates using the MMRP from 2011-12 have been published.
Current Research and Estimations
- Utilization of Consumer Price Index: Most researchers update the base year poverty line using the consumer price index (CPI), which showed significant declines in poverty rates according to SBI research.
- NITI Aayog’s Support: Endorsing these findings, NITI Aayog reported that the poverty rate in India fell below 5% in 2022-23.
- Issues with Methodology: Critics argue that updating an MRP-based poverty line and applying it to MMRP-based consumption data might underestimate current poverty levels.
- International Comparisons: Using a global poverty line of $1.90, other researchers have reported even lower poverty percentages, but this approach is limited to years with available MMRP-based data.
- Data Collection Changes in 2022-23: Recent surveys have implemented multiple questionnaires and visits, potentially enhancing data quality but complicating temporal comparisons.
Temporal Comparability and Political Implications
- Temporal Misalignments: Comparing poverty reduction across different political regimes is challenging due to non-coinciding data points with respective governance periods.
- Rate of Poverty Reduction: Historical data shows varied rates of decline in poverty, with the UPA period seeing a slightly faster reduction compared to the NDA.
- Complexities in Reducing Poverty: As poverty levels decrease, further reductions become increasingly difficult, highlighting the complexity of sustained anti-poverty efforts.
- Impact of Anti-Poverty Measures: The actual effects of specific anti-poverty policies may not be immediately observable following their implementation.
- Political Claims: Both the Congress and the BJP find it difficult to assert definitive superiority in poverty reduction due to the aforementioned challenges.
Conclusion
The debate over poverty reduction in India is nuanced and requires careful consideration of methodological choices, data quality, and temporal alignment. Continuous improvement in data collection and analysis methods is essential to provide a clear and accurate picture of poverty trends and the effectiveness of governmental policies over time.
Poverty Estimation in India
|
Source:Indian Express
Mains Practice Question:
Discuss the evolution of poverty estimation methods in India from the Lakdawala Committee to the Rangarajan Committee. How have these changes influenced the understanding of poverty dynamics in India?
Associated Articles: