
VARIOUS ECONOMIC QUESTIONS ON K-SHAPE RECOVERY
Relevance: GS 3
- Indian Economy and issues relating to planning, mobilization, of resources, growth, development and employment.
Why in News:
- The State Bank of India (SBI) has released a new research paper that intends to “debunk” theories about India’s “K-shaped” economic recovery.
- India’s “K-shaped” economic recovery is being questioned by a new study paper from the State Bank of India (SBI), but there are a number of serious issues with its reasoning.
A K-Shaped Recovery?
- A K-shaped recovery happens when different economic sectors emerge from a recession at different rates, times, or sizes.
- A K-shaped recovery has the potential to reshape the economy and larger society.
- It triggers fundamental changes in economic outcomes and relationships before and after the recession, impacting different segments differently.
- It is named “K-shaped” because it resembles the divergent paths taken by different parts of the economy when plotted together, resembling the arms of the Roman letter “K.”
- Unlike a uniform and simultaneous recovery seen across all sectors, industries, or demographic groups, a K-shaped recovery shows disparities in the pace and extent of resurgence.
Key Highlights from the SBI Report:
- Income Mobility:3% of taxpayers migrated from lower to higher income tax rates between 2013–14 and 2021–22, increasing total income by 21.3%.
- Positive Income Trends: A shift to higher income levels is evident in the 295% increase in tax returns filed by people making between Rs 5 and Rs 10 lakh. The income gap between Rs 10 and Rs 25 lakh has shrank by 291%. Between AY22 and AY23, there were 7.4 crore more income tax filers overall than there were in AY22.
- Female Tax Filers: About 15% of individuals file taxes as individuals are female. There are more women filing taxes in states like West Bengal, Tamil Nadu, Kerala, and Punjab.
- Top Taxpayers Share: In FY14, 1.64% of total income came from the combined earnings of the top 23 persons, each of whose income exceeded Rs 100 crore. Even though there were 136 more of these people in FY21, their aggregate income share decreased to 0.77%.
- MSME Value Chain Integration: Through MSME value chain integration, about 19.5% of small businesses have grown into larger businesses.
- Rise in Consumption: The bottom 90% of the population’s consumption has increased by Rs 8.2 lakh crore since the outbreak.
- Food Ordering Platform Data: The paper highlights a favorable consumption trend and refutes assertions of widespread concern with data from food ordering platforms such as Zomato. According to the survey, sales of two-wheelers are declining as more individuals choose four-wheelers as a replacement.
Summary of the SBI Report’s Conclusion:
- Growth is evident across all income classes, leading to reduced income skewness, with income converging towards the middle from both top and bottom segments.
- The report strongly disputes the idea of a K-shaped recovery, labeling it as biased, unfounded, and driven by the interests of specific groups uncomfortable with India’s progress.
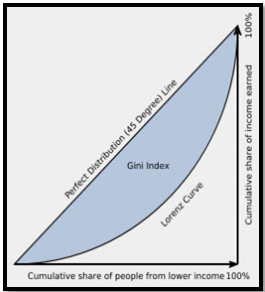
- The Gini coefficient of taxable income, a widely-used measure of income inequality, has significantly decreased from 0.472 to 0.402 during the period of FY14 to FY22, indicating a notable reduction in income inequality.
Critique of the SBI Report
- Questioning the Report’s Conclusions: The SBI report’s arguments against the K-shaped recovery are considered unconvincing.
- Analysis of the Report’s Methodology: The report uses various data points, including income, savings, and policy measures, to challenge the K-shaped recovery narrative.
- Counterarguments to the SBI Findings: The report’s use of certain economic indicators and data, such as two-wheeler sales and income tax figures, is questioned for their relevance and accuracy in depicting economic inequality.
Fundamental Flaws in the SBI Report
- Government Measures Indicating Economic Distress: The extension of subsidized food grain to a vast segment of the population suggests deeper economic issues.
- Reliability of Tax Data: Concerns are raised about the appropriateness of using income tax data to assess broader economic inequality, given the small percentage of the population paying direct taxes.
- Inflation Impact on Income Data: The report’s reliance on nominal income tax data, which is influenced by overall inflation, is critiqued.
The numerous questions raised about the SBI report’s findings are emphasized, suggesting a need for a more thorough examination of India’s economic recovery post-pandemic
| Lorenz Curve and Gini Coefficient
· The distribution of Income in an economy is represented by the Lorenz Curve and the degree of income inequality is measured through the Gini Coefficient. · The Lorenz Curve (the actual distribution of income curve), a graphical distribution of wealth developed by Max Lorenzin 1906, shows the proportion of income earned by any given percentage of the population. · The Gini Coefficient, derived from the Lorenz Curve, is a metric used to gauge a country’s economic development. · It quantifies the extent of income equality within a population. · The Gini Coefficient ranges between 0 (indicating perfect income equality) and 1 (indicating perfect income inequality). · A Gini Coefficient of 0 suggests that everyone in the population has the same income. · Conversely, a Gini Coefficient of 1 signifies extreme income inequality, where one individual or group possesses all the income, while others have none. |
Mains Question
“Examine the SBI report’s assertions about shifting consumer behavior from two-wheelers to real estate and automobiles. How far does this change represent current economic conditions, and what does it mean for the larger discussion of economic inequality?”
Source
Indian Express