The northern plains of India is the most polluted region.
Relevance:
- GS 3 Pollution, Man-made disaster.
- Tags: #upsc #competitiveexams #Airqualitylifeindex #WHO #Globalpopulation.
Why in the news?
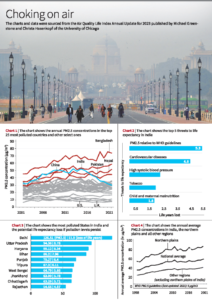
- Data from the Air Quality Life Index 2021 shows that failure to meet the World Health Organization (WHO) guidelines on reducing PM2.5 (particulate matter) pollution to 5 g/m3 would cut global life expectancy by 2.3 years.
- South Asia is at the centre of the crisis. According to AQLI data, from 2013 to 2021, particulate pollution in South Asia surged by 9.7%, which is estimated to reduce life expectancy in the region by an additional six months.
- Bangladesh, India, Nepal, and Pakistan, where 22.9% of the global population lives, are the most polluted countries in the world.
- In Bangladesh, the most polluted country in 2021, people potentially lost an average of 6.8 years of life due to air pollution not meeting WHO guidelines. In contrast, the average person from the U.S. lost just 3.6 months.
- Notably, China stands out due to its success in reducing pollution by a staggering 42.3% from 2013 to 2021 and extending the average life expectancy of its population by 2.2 years. This reduction can be attributed to the country’s policy initiatives to combat pollution in 2014.
About India ‘s case
- In India, the second-most polluted country in the world in 2021, particulate pollution is the greatest threat to human health. Data reveal a further rise in PM2.5 pollution from 56.2 g/m3 in 2020 to 58.7 g/m3 in 2021, exceeding the WHO guidelines by more than 10 times.
- The average Indian resident is set to lose 5.3 years of life expectancy if WHO guidelines remain unmet. In contrast, cardiovascular diseases reduce the average Indian’s life expectancy by about 4.5 years, while child and maternal malnutrition reduces it by 1.8 years.
- Chart 3 shows the most polluted States in India and the potential life expectancy loss if pollution levels do not meet WHO guidelines. In Delhi, the world’s most polluted city, 18 million people could lose 11.9 years of life expectancy relative to the WHO guideline and 8.5 years of life expectancy relative to the national guideline if current pollution levels persist.
- The northern plains, home to over half a billion people and 38.9% of India’s population, is the most polluted region.
- The northern plains include the States and Union Territories of Bihar, Chandigarh, Delhi, Haryana, Punjab, Uttar Pradesh, and West Bengal. Chart 4 shows the annual average PM2.5 concentrations in India, the northern plains, and all other regions.
- In the northern plains, the average resident is set to lose about 8 years of life expectancy if pollution levels persist and policies do not succeed in reducing pollution to levels as prescribed by the WHO.
- Pollution, once concentrated in the northern region, has spread to other parts of the country over the last two decades. For instance, in Maharashtra and Madhya Pradesh, which have a combined population of 204.2 million, pollution has surged by 76.8% and 78.5%, respectively.
- Since 2000, causing a loss of an additional 1.8 years to 2.3 years of life expectancy compared to 2000 levels.
About Air Quality Life Index (AQLI)
- Developed by the University of Chicago’s Milton Friedman Distinguished Service Professor in Economics, Michael Greenstone, and his team at the Energy Policy Institute at the University of Chicago (EPIC).
- The index also illustrates how air pollution policies can increase life expectancy when they meet the WHO’s guideline for a safe level of exposure, existing national air quality standards or user-defined air quality levels.
- This information can help inform local communities and policymakers about the importance of air pollution policies in concrete terms.
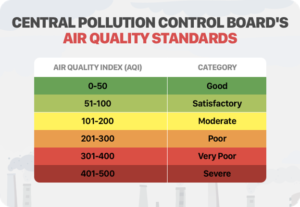
- Launched in 2014 with outline ‘One Number – One Color -One Description’ for the common man to judge the air quality within his vicinity.
| Daily AQI Color | Levels of Concern | Values of Index | Description of Air Quality |
| Green | Good | 0 to 50 | Air quality is satisfactory, and air pollution poses little or no risk. |
| Yellow | Moderate | 51 to 100 | Air quality is acceptable. However, there may be a risk for some people, particularly those who are unusually sensitive to air pollution. |
| Orange | Unhealthy for Sensitive Groups | 101 to 150 | Members of sensitive groups may experience health effects. The general public is less likely to be affected. |
| Red | Unhealthy | 151 to 200 | Some members of the general public may experience health effects; members of sensitive groups may experience more serious health effects. |
| Purple | Very Unhealthy | 201 to 300 | Health alert: The risk of health effects is increased for everyone. |
| Maroon | Hazardous | 301 and higher | Health warning of emergency conditions: everyone is more likely to be affected. |
Five major pollutants
EPA establishes an AQI for five major air pollutants regulated by the Clean Air Act. Each of these pollutants has a national air quality standard set by EPA to protect public health.
- Ground-level ozone.
- Particle pollution (also known as particulate matter, including PM2.5 and PM10).
- Carbon monoxide.
- Sulfur dioxide.
- Nitrogen dioxide.
Measures to improve air quality
- Improving public transport.
- Limiting the number of polluting vehicles on the road.
- Introducing less polluting fuel.
- Strict emission regulations.
- Improved efficiency for thermal power plants and industries.
- Moving from diesel generators to rooftop solar.
- Increased use of clean renewable energy.
- Electric vehicles.
- Removing dust from roads.
- Regulating construction activities.
- Stopping biomass burning, etc.
What are the Initiatives Taken for Controlling Air Pollution in India?
- System of Air Quality and Weather Forecasting and Research (SAFAR) Portal.
- Air Quality Index: AQI has been developed for eight pollutants viz. PM2.5, PM10, Ammonia, Lead, nitrogen oxides, Sulphur dioxide, ozone, and carbon monoxide.
- Graded Response Action Plan (for Delhi): a set of emergency measures that kick in to prevent further deterioration of air quality once it reaches a certain threshold in the Delhi-NCR region.
- For Reducing Vehicular Pollution:
-
- BS-VI Vehicles,
- Push for Electric Vehicles (EVs),
- Odd-Even Policy as an emergency measure (for Delhi).
- Subsidy to farmers for buying Turbo Happy Seeder (THS) Machine for reducing stubble burning.
- National Clean Air Program (NCAP): The Government has launched the National Clean Air Program(NCAP) as a long-term, a time-bound program to reduce air pollution in a comprehensive manner with a target to achieve up to 40% reduction in PM10 concentration level by the year 2025-2026 w.r.t. baseline of 2017-18.
- The concept of LiFE: It was introduced by the Prime Minister at COP26 in Glasgow. It is a LiFE envisions replacing the prevalent ‘use-and-dispose’ economy—governed by mindless and destructive consumption—with a circular economy, which would be defined by mindful and deliberate utilization.
- Nationally Determined Contributions (NDCs): India updated its Nationally Determined Contributions (NDCs) – plans to limit global warming to 1.5 degrees Celsius, promising to reduce the emissions intensity of GDP by 45% by 2030, from the 2005 level, and achieve 50% cumulative electric power installed capacity from non-fossil fuel-based energy resources by 2030.
- Commission for Air Quality Management: The Commission has been set up for Air Quality Management in the National Capital Region and Adjoining Areas for better coordination, research, identification, and resolution of problems surrounding the air quality index and for matters connected therewith or incidental thereto.
- Graded Response Action Plan (GRAP): It is a set of emergency measures that kick in to prevent further deterioration of air quality once it reaches a certain threshold in the Delhi-NCR region.
- The Pradhan Mantri Ujjwala Yojana Household LPG program and other schemes have helped to dramatically expand access to clean energy, especially for rural households.
Consequences of Air Pollution
- Large number of deaths (around 2000) is attributed due to pollution which is very frightening. The figures may not be correct because they are only estimates. To find out precise data it requires a serious investigation for which neither the man power is available nor are the time and resources available. Therefore we need to take a precautionary approach towards tackling pollution.
- India has recorded 50% increase in the pre mature deaths linked to PM 2.5 and this is between 1990 and 2015 almost coinciding with the economic liberalization.
- Air quality has become a serious health issue because the pollutants entre deep inside the lungs and the lungs capacity to purify bloods gets reduced which affects the person’s growth, mental ability and the working capacity especially for children, pregnant women and elderly people.
- Poor people are more vulnerable to air pollution because they are the one who spend more time on roads.
Way Forward
- WHO’s 4 Pillar Strategy: WHO adopted a resolution (2015) to address the adverse health effects of air pollution. There is a need to adhere to a roadmap highlighted under this.
- This 4-pillar strategy calls for an enhanced global response to the adverse health effects of air pollution. Those four pillars are:
- Expanding the knowledge base
- Monitoring and reporting
- Global leadership and coordination
- Institutional capacity strengthening
- Proactive Measure: Interventions like pollution-monitoring apps should be promoted, so that people can choose to avoid the travelling worst times, and take alternative city walking routes that keep people away from the most polluted areas. The application of Graded Response Action Plan in the Delhi-National Capital Region (NCR) is a step in the right direction.
- Innovative Measure: There is a need to adopt innovative solutions for in-situ treatment of pollution. For example, the Delhi government is also experimenting with a new organic way of decomposing stubble with Indian Agriculture Research Institute’s “Pusa decomposer”.
- Responsibility of Citizens: Despite plenty of ideas and solutions to tackle air pollution, still conditions remain the same. This is due to the lack of serious political will and people’s participation. Therefore, citizens should continue to stand up for their right to healthy and sustainable environments and hold governments accountable.
- Addressing Injustice: There are huge injustices at the heart of the air pollution problem as the Poorer people are also most exposed to air pollution. Thereby, the need to enforce Polluter Pay principle and an environment tax must be levied from industries of polluting in nature.
Source: The Hindu.
Mains Question
What are the difference between natural disaster and man induced disaster. Discuss the causes and impacts of air pollution on health and economy. Also suggest various measures to improve the status of air pollution in India.