POVERTY DECLINES, GDP GROWTH DRIVES CHANGE
POVERTY DECLINES, GDP GROWTH DRIVES CHANGE
Syllabus:
GS-3: ● Indian Economy ● Poverty and related issues
Why in the News?
The recent Household Consumption Expenditure Survey (2022–23) and National Statistical Office (NSO) estimates for 2023–24 indicate a significant reduction in poverty and consumption inequality in India. The poverty rate in India 2022 fell into single digits — a notable shift driven by economic growth and stable inflation. This GDP data provides new insights into development patterns and poverty reduction metrics, including how poverty line is estimated in India.
POVERTY RATE IN SINGLE DIGITS
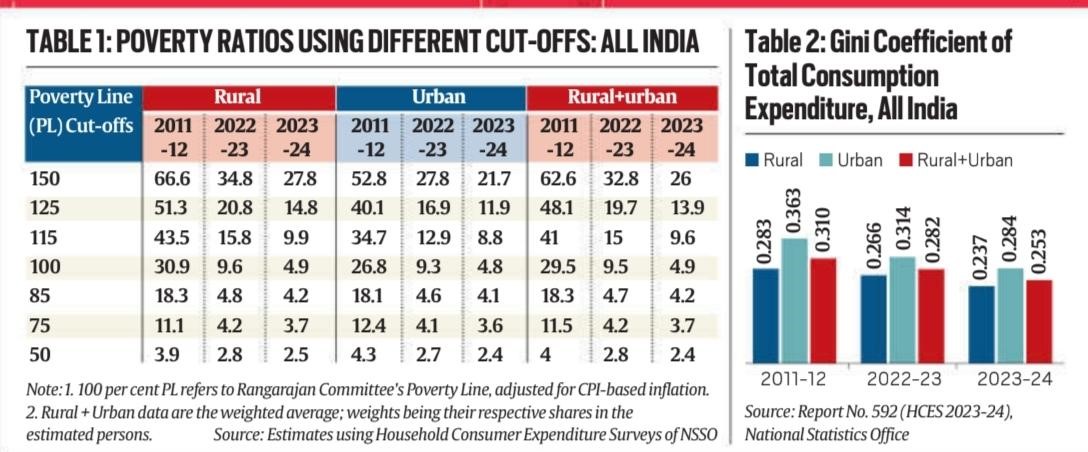
- Sharp Decline: India’s total poverty ratio dropped from 29.5% in 2011-12 to 4.9% in 2023-24, highlighting steady gains over the last decade. This reduction in the poverty gap has been particularly pronounced in India’s poor states, including those traditionally considered the most poor states in India.
- Faster Drop: Poverty fell 2.05 percentage points annually between 2011-12 and 2023-24, only slightly lower than 2.2 points during 2004–05 to 2011–12.
- Rural Improvement: Rural poverty line rose from ₹972 to ₹1,940, showing that improved rural consumption and investment in rural infrastructure has contributed to decreasing deprivation. This has helped address the rural urban divide in India.
- Urban Progress: Urban poverty line increased from ₹1,407 to ₹2,736, reflecting better urban wages and expanded economic opportunities. This has contributed to reducing urban poverty in India.
- Steepest Fall: Between 2022–23 and 2023–24, poverty dropped from 9.5% to 4.9%, suggesting an unusually sharp annual improvement. This trend is reflected in the changing poverty in rural and urban areas in India.
GDP GROWTH AS KEY DRIVER
- Growth Surge: GDP growth rose from 7.6% to 9.2% between 2022–23 and 2023–24, supporting higher incomes and increased spending power. The GDP of India in 2022 showed strong performance, contributing to poverty alleviation. Even states like Uttar Pradesh, often considered one of the most poor states in India, saw improvements, with the GDP of UP rising significantly.
- Price Stability: Consumer Price Index (CPI) inflation fell from 6.7% to 5.4%, providing real income gains and supporting consumption-led growth. The consumer price index table India shows a consistent trend of moderation.
- Welfare Flat: Welfare schemes, including direct benefit transfers, did not expand significantly, suggesting economic growth—not redistribution—as the primary poverty-reducing force.
- Food Worries: Food inflation rose from 6.6% to 7.5%, partially offsetting gains and pressuring vulnerable households. The food inflation impact was particularly felt among the near-poor population.
- Cautious Optimism: Analysts recommend caution as this sudden improvement must be tested with more years of consistent data.
WORLD BANK VALIDATION REPORT
- Global Praise: The World Bank’s recent report validated India’s success, calling poverty reduction significant across all key international thresholds.
- Extreme Poverty: Those living under $2.15/day PPP dropped from 16.2% to 2.3%, moving over 170 million people out of extreme deprivation. This demonstrates the impact of purchasing power parity on poverty reduction. The PPP of India vs US shows significant improvement in India’s relative economic position.
- Middle-Income Line: Under the $3.65/day metric, poverty fell from 61.8% to 28.1%, reflecting better basic service access and rural income diversification.
- Cross-Validation: Independent international data adds credibility to Indian estimates and confirms that the decline is not merely statistical.
- India’s Lead: Among over 100 developing nations, including many poor countries in world 2023, India stands out as a model of inclusive growth and macroeconomic management.
UNDERSTANDING POVERTY DEPTH
- Multi-Cutoff Trends: Poverty ratios using higher poverty lines also show a consistent and even stronger decline, confirming wider welfare improvements. This approach helps in understanding how poverty line is estimated in India and its impact on poverty measurements.
- 125% Line: Using 125% of the poverty line, poverty declined 28.4 points (to 2022–23) and 34.2 points (to 2023–24), indicating depth reduction.
- Not Deeply Poor: Over 50% of the poor are located between the third and fourth quarter of the poverty line — not in extreme destitution.
- Targeted Approach: This concentration near the poverty line makes poverty easier to tackle with precise welfare interventions.
- Near-Poor Challenge: A large non-poor section sits just above the poverty line — vulnerable to economic shocks like inflation or job loss.
CONSUMPTION INEQUALITY DECLINING
- Gini Down: Gini coefficient fell from 0.310 (2011–12) to 0.282 (2022–23) and further to 0.253 (2023–24) — a marked decline in consumption inequality.
- Urban Boost: Urban areas saw a greater inequality drop, likely due to digitization, better access and higher employment elasticity.
- Unusual Drop: The 0.029 point fall between 2022–23 and 2023–24 matches the entire 11-year prior improvement, raising questions on data volatility.
- Wealth Gaps: While consumption inequality declined, asset and wealth gaps may still persist — not captured by expenditure-based surveys.
- Policy Potential: Falling inequality offers policy space for inclusive growth, targeting education, skilling, and infrastructure in backward regions to address regional economic disparities, especially in India’s poor states.
SUSTAINABILITY OF POVERTY REDUCTION
- Data Continuity: Future surveys are needed to confirm if this year’s sharp poverty decline is a trend or an anomaly.
- Structural Shift: Growth-driven poverty reduction may reflect a structural economic shift rather than cyclical welfare interventions.
- Policy Alignment: Macroeconomic stability, rural job creation, and agriculture reforms will be essential for sustaining poverty reduction.
- Resilience Need: With many near the poverty line, economic shocks like climate events or pandemics could reverse these fragile gains.
- Data Caution: Experts urge cross-verification of findings across multiple rounds and methods to ensure robustness of conclusions.
WAY FORWARD FOR POLICYMAKERS
- Deeper Mapping: A comprehensive look into multi-dimensional poverty—health, education, housing—must supplement monetary surveys. The Rangarajan Committee recommendations on poverty measurement should be considered to refine how poverty line is estimated in India.
- Strengthen Safety: Even with declining poverty, robust safety nets are needed to prevent the vulnerable slipping back into deprivation.
- Skill Push: Invest in education and vocational training to push households further above the poverty line.
- Inclusive Growth: Ensure job-rich growth through MSMEs, rural industries, and green jobs to solidify long-term reductions.
- Better Metrics: Build dynamic, real-time poverty tracking tools using Aadhaar-linked consumption data to support responsive policymaking. This could include tracking monthly per capita consumption expenditure and head count ratio.
CONCLUSION
India’s poverty ratio dropping to single digits is a historic development. GDP growth, modest inflation, and proximity of most poor near the poverty line made this possible. However, this sharp one-year decline needs further scrutiny to determine if it reflects a sustainable trend. The economic survey 2023-24 and ongoing surveys will provide more insights into poverty alleviation efforts. Continued focus on reducing the rural urban divide in India, addressing income inequality, and implementing effective welfare programmes will be crucial for maintaining this positive trajectory in poverty reduction.
As a conclusion on poverty, while significant progress has been made, challenges remain. Comparing India’s performance to the world per capita income 2023 and other developing nations shows both achievements and areas for improvement. States like Andhra Pradesh have shown promising growth, with the per capita income of AP rising steadily. However, regional disparities persist, and sustained efforts are needed to ensure inclusive growth across all states and demographics, particularly in India’s poorest states.