
K-SHAPED QUESTIONS
Relevance:
GS 3
- Indian Economy and issues relating to planning, mobilization, of resources, growth, development and employment.
Why in News:
New research report by the State Bank of India (SBI) seeks to “debunk” claims of india’s”K-shaped” economic recovery.
Source- TOI
 Source- TOI
A new research report by the State Bank of India (SBI) aims to challenge the notion of India’s “K-shaped” economic recovery, but several critical questions arise regarding its arguments.
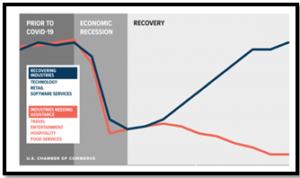
What Is a K-Shaped Recovery?
Source- Forbes
 Source- Forbes
- A K-shaped recovery occurs when various segments of the economy rebound from a recession at distinct rates, timings, or scales.
- Unlike a uniform and simultaneous recovery seen across all sectors, industries, or demographic groups, a K-shaped recovery displays disparities in the pace and extent of resurgence.
- A K-shaped recovery has the potential to reshape both the economy and broader society.
- It triggers fundamental changes in economic outcomes and relationships before and after the recession, impacting various segments differently.
- This recovery is termed “K-shaped” due to its resemblance to the divergent paths taken by different parts of the economy when plotted together, resembling the arms of the Roman letter “K.”
Key Highlights from the SBI Report:
- Income Mobility: Between 2013-14 and 2021-22, 36.3% of taxpayers moved from lower to higher income tax brackets, resulting in a 21.3% increase in total income.
- Positive Income Trends: Tax returns filed by individuals earning between Rs 5 – 10 lakh surged by 295%, indicating a shift to higher income ranges. Those earning between Rs 10 – 25 lakh also increased by 291%. The total number of income tax filers grew from 7 crore in AY22 to 7.4 crore in AY23.
- Female Tax Filers: Female tax filers constitute approximately 15% of individual tax filers. States like Kerala, Tamil Nadu, Punjab, and West Bengal have a higher proportion of female tax filers.
- Top Taxpayers Share: In FY14, the combined income of the top 23 individuals with incomes exceeding Rs 100 crore accounted for 1.64% of the total income. Despite an increase to 136 such individuals in FY21, their combined income share dropped to 0.77%.
- MSME Value Chain Integration: About 19.5% of small firms have transitioned into larger firms through MSME value chain integration.
- Consumption Increase: Post-pandemic, consumption by the bottom 90% of the population has risen by Rs 8.2 lakh crore.
- Food Ordering Platform Data:
- The report cites data from food ordering platforms like Zomato to counter claims of widespread distress, highlighting a positive consumption trend.
- Shift from Two-Wheelers to Four-Wheelers:
- The report notes a decline in two-wheeler sales, with people increasingly opting for four-wheelers as a substitute.
Summary of the SBI Report’s Conclusion:
- Growth is evident across all income classes, leading to reduced income skewness, with income converging towards the middle from both top and bottom segments.
- The report strongly disputes the idea of a K-shaped recovery, labeling it as biased, unfounded, and driven by the interests of specific groups uncomfortable with India’s progress.
- The Gini coefficient of taxable income, a widely-used measure of income inequality, has significantly decreased from 0.472 to 0.402 during the period of FY14 to FY22, indicating a notable reduction in income inequality.
Critique of the SBI Report
- Questioning the Report’s Conclusions: The SBI report’s arguments against the K-shaped recovery are considered unconvincing.
- Analysis of the Report’s Methodology: The report uses various data points, including income, savings, and policy measures, to challenge the K-shaped recovery narrative.
- Counterarguments to the SBI Findings: The report’s use of certain economic indicators and data, such as two-wheeler sales and income tax figures, is questioned for their relevance and accuracy in depicting economic inequality.
Fundamental Flaws in the SBI Report
- Government Measures Indicating Economic Distress: The extension of subsidized food grain to a vast segment of the population suggests deeper economic issues.
- Reliability of Tax Data: Concerns are raised about the appropriateness of using income tax data to assess broader economic inequality, given the small percentage of the population paying direct taxes.
- Inflation Impact on Income Data: The report’s reliance on nominal income tax data, which is influenced by overall inflation, is critiqued.
The numerous questions raised about the SBI report’s findings are emphasized, suggesting a need for a more thorough examination of India’s economic recovery post-pandemic
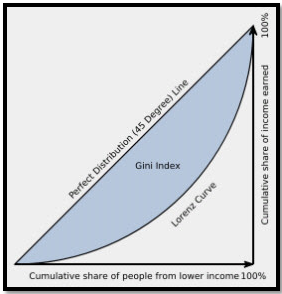
Lorenz Curve and Gini Coefficient
· The distribution of Income in an economy is represented by the Lorenz Curve and the degree of income inequality is measured through the Gini Coefficient. · The Lorenz Curve (the actual distribution of income curve), a graphical distribution of wealth developed by Max Lorenzin 1906, shows the proportion of income earned by any given percentage of the population. · The Gini Coefficient, derived from the Lorenz Curve, is a metric used to gauge a country’s economic development. · It quantifies the extent of income equality within a population. · The Gini Coefficient ranges between 0 (indicating perfect income equality) and 1 (indicating perfect income inequality). · A Gini Coefficient of 0 suggests that everyone in the population has the same income. · Conversely, a Gini Coefficient of 1 signifies extreme income inequality, where one individual or group possesses all the income, while others have none. |
 Source- Maxipedia
Source
Indian Express
Mains Question
“Examine the SBI report’s arguments regarding the shifting consumer behavior from two-wheelers to real estate and cars. To what extent does this shift reflect economic dynamics, and how does it relate to the broader debate on economic inequality?”