Is Poverty Being Underestimated in India?
Syllabus:
GS – 3- Poverty estimation, Human development , economic development
Focus :
The article critically examines whether poverty in India is being underestimated by exploring the challenges with poverty definitions, methodologies, and data collection practices. It analyzes urban-rural poverty trends, critiques multidimensional poverty indices, and discusses the need for a clear methodology for poverty line estimation, focusing on recent debates and survey data.
Introduction: The Context of Poverty Measurement in India
- India recently released the 2023-24 Household Consumption Expenditure Survey (HCES),sparking debates about poverty trends.
- Policymakers, researchers, and academics are questioning the accuracy and comparability of poverty data.
- Key issues include data unavailability, changing methodologies, and varying definitions of poverty.
Understanding Poverty: Historical Context and Evolving Definitions
- 1970s-2005 Period:
- Poverty was measured by estimating expenditure required to sustain a minimum calorie diet.
- Data from the National Sample Survey Office (NSSO) was used, and estimates were consistent with national accounts.
- Post-2005 Developments:
- The divergence between NSSO data and National Accounts began to raise concerns.
- The Tendulkar Committee redefined poverty, incorporating mixed recall periods (MRP).
- Multidimensional poverty indices gained prominence, broadening poverty definitions.
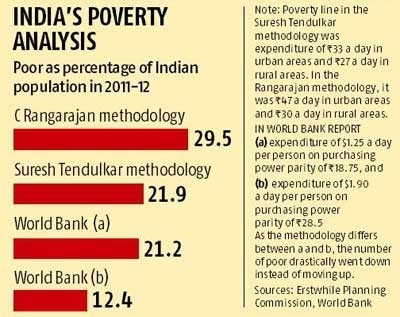
- New methodologies led to claims of drastic poverty reductions, but the results are contentious due to the reliance on different poverty lines.
Recent Trends in Poverty: The Debate Over Declining Rates
- Reduction in Poverty:
- Over the last two decades, poverty has significantly declined, driven by:
- High GDP growth.
- Flagship welfare programs by the Union and State governments.
- Improved public delivery systems.
- National Food Security Act, benefiting nearly 80 crore people.
- Estimates:
- Rangarajan’s 2022-23 survey suggests poverty near 10%.
- Recent HCES data indicates further decline, potentially into single digits.
- Concerns Over Estimations:
- Poverty reduction claims depend heavily on the choice of poverty line and data sets.
- Tendulkar and Rangarajan methodologies produce varying figures, though trends show consistent declines (~17%-18% reduction over decades).
- Over the last two decades, poverty has significantly declined, driven by:
Challenges in Data Collection and Methodology
Divergence Between NSSO and National Accounts:
- Key issues include inconsistent recall periods (7-day, 30-day, and 365-day reference periods).
- Changes in methodology, such as mixed and modified mixed reference periods, complicate comparisons.
Impact of Methodology on Poverty Estimates:
- Modified recall periods result in higher expenditure reporting, leading to lower poverty estimates when using older poverty lines.
- The NSSO’s recent practice of visiting households in multiple sittings improves data accuracy but introduces new challenges for trend analysis.
Lack of a New Poverty Line:
- Few researchers have proposed a poverty line aligning with new NSSO methodologies, leaving a critical gap in policy and research.
Rural-Urban Consumption Convergence:
- Data shows a narrowing gap between rural and urban consumption patterns.
- Rural areas are increasingly resembling peri-urban or urban areas in terms of diversity in consumption.
Challenges in Defining Rural and Urban Areas:
- Current definitions are outdated, based on the 2011 Census.
- A reclassification of peri-urban areas could reveal faster urban poverty reductions.
Debates on Poverty Line Revision
- The Foundation for Agrarian Studies estimated poverty at 25% using Rangarajan’s methodology for 2022-23.
- However, UNDP’s $2.15/day poverty line placed India’s poverty at 12.9% in 2019.
- Discrepancies highlight the urgent need for a unified methodology.
- Need for Government-Endorsed Standards:Researchers advocate for a clear, government-backed poverty line that can be consistently applied to updated data sets.
Multidimensional Poverty Index (MPI): Validity and Criticism
- India’s MPI vs. UNDP’s MPI:
- The UNDP’s MPI includes 10 indicators, while India’s version includes 12, adding bank accounts and maternal health.
- Broader indicators align better with India’s socioeconomic context.
- Criticism of MPI Indicators:
- Some indicators, such as access to electricity or bank accounts, are static and unlikely to show deprivation once achieved.
- The index may not fully capture the dynamic nature of poverty.
- Strengths and Weaknesses:
- MPI captures multidimensional aspects of deprivation but may underestimate poverty trends due to its reliance on static indicators.
Policy Implications and Future Directions
- A balanced approach combining traditional consumption-based measures with multidimensional indices is necessary.
- Frequent updates to poverty lines and methodologies are essential to reflect changing consumption patterns.
- Enhanced survey methods, such as multiple household visits, should be institutionalized.
- Greater consistency in reference periods will improve comparability across datasets.
- Continued investment in welfare programs and delivery systems is critical to sustaining poverty reduction.
- Special attention should be paid to emerging vulnerabilities in peri-urban and rural areas.
Conclusion: Bridging the Gaps in Poverty Estimation
- The debate on poverty in India underscores the complexities of measurement, data collection, and methodology.
- While poverty has undeniably declined, varying estimates highlight the need for a unified framework.
- Addressing these gaps will ensure more accurate assessments and effective policymaking.
Associated Article
https://universalinstitutions.com/poverty-and-inequality/
Mains UPSC Question GS 3
Discuss the challenges in poverty estimation in India, focusing on the evolution of poverty definitions, methodologies, and recent trends. (250 words)


