HAS POVERTY REALLY DROPPED TO 5% IN INDIA?
Syllabus:
GS 2: Issues relating to Poverty and Hunger.
Why in the news?
The debate over India’s poverty rate resurgence sparked by NITI Aayog’s claim of less than 5% living below the poverty line, drawing scrutiny on data quality and interpretation.
 Source : scrollon
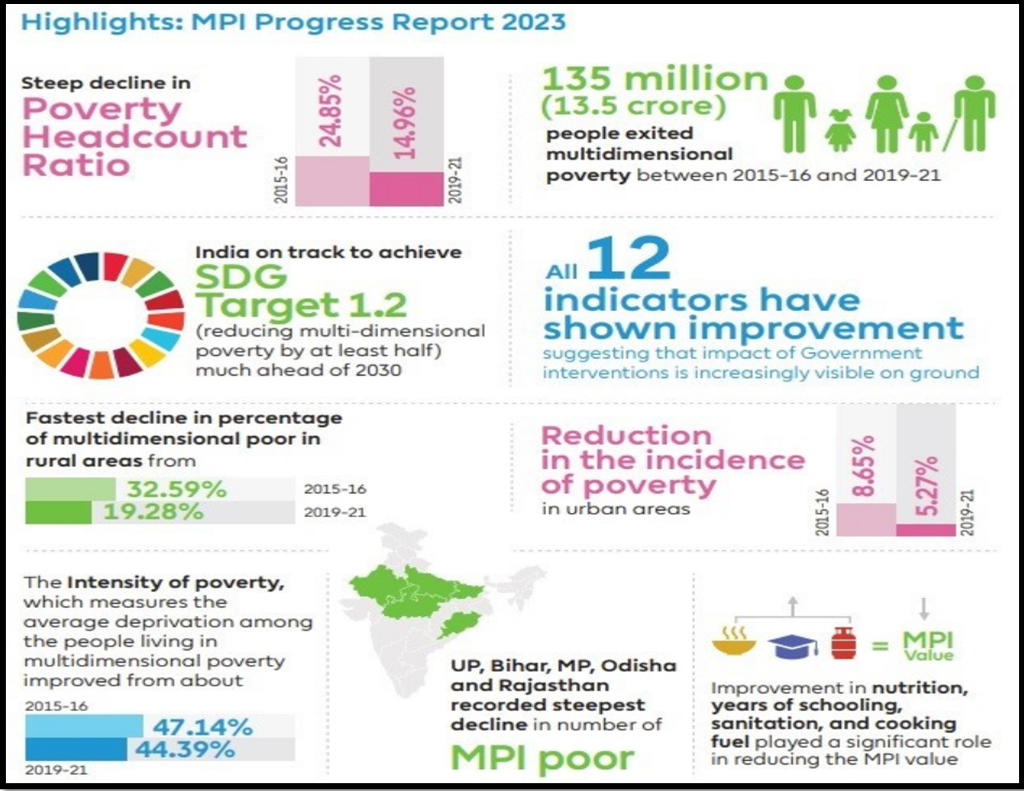
Defining Poverty in India:
- V.R. Subrahmanyam of NITI Aayog claims poverty has reduced to less than 5% based on the HCES 2022-23.
- Surjit Bhalla argues poverty has declined from5% in 2011-12 to around 2% in 2022-23, suggesting a need to raise the poverty line.
- Jayati Ghosh highlights the absence of a declared income poverty line in India, questioning the accuracy of poverty estimates.
| What is the National Multidimensional Poverty Index (MPI)?
● National Multidimensional Poverty Index (MPI) is an indigenized index monitored by NITI Aayog. ● It involves an inter-ministerial MPI Coordination Committee (MPICC) overseeing areas like health, education, nutrition, rural development, among others. Deprivation Score Calculation:
Indices of MPI:
o Calculated by dividing the number of multidimensionally poor persons by the total population.
o The weighted deprivation scores of all poor people are summed and divided by the total number of poor people. MPI Calculation: · MPI is computed as the product of Headcount Ratio (H) and Intensity of Poverty (A). About Recent MPI-India Findings 2023:
Ø 24.82 crore Indians have escaped multidimensional poverty in the last 9 years. Ø Steep decline in Poverty Headcount Ratio from 29.17% in 2013-14 to 11.28% in 2022-23.
Ø All 12 MPI indicators show significant signs of improvement.
Ø Uttar Pradesh, Bihar, and Madhya Pradesh witnessed the largest decline in the number of MPI poor between 2013-14 and 2022-23. Ø Poorer states recorded a faster decline in poverty, indicating a reduction in disparities.
Ø India is on track to achieve SDG Target 1.2 of reducing multidimensional poverty by at least half much ahead of 2030. What is the Gini Coefficient?
|
Understanding Consumption and Income Trends:
- Bhalla asserts that consumption has increased by 40% in real terms over the last 11 years, supported by wage growth and tax data.
- Ghosh challenges this, citing studies showing minimal real wage growth and increased unpaid family labour.
- Discrepancies in data quality between government and private sector sources are noted.
- Consumption growth is primarily observed in top deciles, signalling unequal distribution of wealth.
About Nutrition and Well-being:
- Ghosh stresses the importance of nutrition, citing a UN report indicating the majority of Indians cannot afford a minimum nutritious diet.
- Bhalla references past misconceptions about calorie consumption, supporting a more sophisticated approach to nutrition assessment
NITI Aayog’s Stand on HCES 2022-23 Findings:
- Poverty Reduction: Less than 5% of the population is projected to fall below the poverty line based on the HCES 2022-23 findings.
- Inflation Assessment: Retail inflation has been deemed overstated, suggesting a need for reassessment.
- Broad-based Growth: Rural India’s income and spending are increasing at a faster rate compared to urban areas, indicating broad-based growth.
- Declining Inequality: The urban-rural consumption divide has narrowed from 91% in 2004-05 to 71% in 2022-23, indicating a decline in inequality.
- Shift in Spending Patterns:
- Rural households’ spending on food has dropped below 50% of total expenditure, indicating diversification.
- Less than 5% of per capita consumer expenditure is allocated to pulses and cereals.
- There’s higher expenditure on conveyances and consumer durables, suggesting improved living standards.
- Increase in Non-food Spending: The findings suggest an increase in earnings and a decrease in spending on food, while spending on items like TV sets, fridges, mobile phones, and cars is rising.
- Change in Lifestyle: The shift in spending patterns signifies both income improvement and lifestyle changes, reflecting overall betterment.
Criticism of Government Data Reliability:
- Advocating Debate: An expert suggests a broader discourse on private sector data precision and supports government data despite the non-release of the 2017-18 survey.
- Political Numbers: Another expert underscores the politicization of statistics in India and the concealment of crucial survey findings and audit reports.
- Acknowledging Advancements: Experts recognize the increased expenditure on non-essential items as a positive indicator but stress the necessity of income augmentation.
- Nutritional Challenges: A UN report unveils that a considerable segment of the populace struggles to afford a basic nutritious diet, highlighting ongoing obstacles.
- Shifting Metrics: Experts point out the transition from calorie-centric measurements to absolute income thresholds in poverty assessment, signifying advancement.
Critique on Data Quality and Interpretation:
- Quality Query: An expert raises doubts regarding the precision of private sector data, expressing reservations about CMIE statistics.
- Data Politicization: Another expert argues against the politicization of data in India, citing delays in release and selective dissemination of information.
- Nutritional Concerns: A UN report indicates that 74% of Indians lack the means to afford a basic nutritious diet, prompting scrutiny of poverty metrics.
Conclusion:
Need for transparent, unbiased data collection and analysis to inform policy decisions accurately.Bhalla emphasises the shift from calorie-based indicators to absolute income levels in poverty assessment. Ghosh stresses the importance of holistic indicators like nutrition in measuring well-being, highlighting ongoing economic disparities.
Source:
Mains Practice Question:
Examine the methodology behind the National Multidimensional Poverty Index (MPI) and its recent findings. Critically analyze the reliability of government data in assessing poverty, considering alternate viewpoints and challenges posed by private sector data.