THE SHEET ANCHOR OF THE FACT SHEET
Syllabus:
GS 3 :
- Indian Economy and issues relating to Planning, Mobilization of Resources
- Income and Consumption Pattern in India..
Why in the news?
Shifts in India’s consumption patterns reflect changing incomes and preferences, with rural-urban distinctions blurring, according to recent reports.
Understanding Consumption Trends in India:
- Overview:
Analysis of consumption patterns in India reveals interesting shifts in spending habits over time.
- Consumer Behaviour:
The principles of microeconomics help in understanding consumer behaviour, particularly regarding inferior goods and Giffen goods.
- Robert Giffen:
Known for his observations on consumer behaviour, Giffen’s insights challenge traditional economic theories.
| What is A Household Consumer Spending Survey?
● A Household Consumer Spending Survey is conducted every five years by NSSO, under the Ministry of Statistics and Programme Implementation. ● Gather data on household consumption spending patterns across urban and rural areas. ● Reveals average expenditure on goods and services and estimates Monthly Per Capita Consumer Expenditure (MPCE). ● Aids in understanding demand dynamics and shifting priorities for producers and service providers. ● Helps identify and address structural anomalies affecting demand patterns. ● Contributes to rebasing Gross Domestic Product (GDP) and other macroeconomic indicators. About NSSO (National sample survey office): ● Established in 1950 to conduct extensive sample surveys across India. ● Employs personnel from the Indian Statistical Service (appointed via UPSC) and the Subordinate Statistical Service (appointed via the Staff Selection Commission). About Central Statistics Office (CSO): ● Responsible for coordinating statistical activities in India and maintaining statistical standards. ● Activities include compiling National Account Statistics (NAS), conducting Annual Survey of Industries (ASI), Economic Censuses, Index of Industrial Production (IIP), Consumer Price Indices, Human Development Statistics, Gender Statistics, and providing statistical training. ● Also involved in Five Year Plan work, broadcasting statistical information, and revising National Industrial Classification. About National Statistical Office (NSO): ● The merger of NSSO and CSO did not specify the role of NSO, and as of February 2021, its official website is inactive. ● Critics argue that the merger may undermine the autonomy of NSSO as it becomes part of the Ministry of Statistics and Programme Implementation (MoSPI). ● Placing the merged entity under the MoSPI Secretary raises concerns about the independence of the data collection and publication process for official surveys. |
Highlights of the Recent Household Consumption Expenditure Survey (HCES)
- The HCES is a periodic survey conducted by the National Statistical Office (NSO) every 5 years to collect data on household consumption patterns.
- It serves as a crucial source for estimating various macroeconomic indicators such as GDP, poverty rates, and the Consumer Price Index (CPI).
Key Findings:
- Poverty Reduction Trends:
- NITI Aayog reported a decline in poverty rates to 5% nationally based on the latest HCES.
- The survey results indicate a significant decline in poverty rates, particularly in rural areas, compared to previous estimates using different methodologies.
- Increase in Monthly Per Capita Consumption Expenditure (MPCE):
- Urban households witnessed a5% increase in MPCE since 2011-12, reaching ₹3,510, while rural India saw a 40.42% increase to ₹2,008.
- Food items constituted 46% of rural household expenditure and 39% of urban household expenditure in 2022-23.
- Distribution of MPCE by Population Percentiles:
- The bottom 5% of India’s rural population had an average MPCE of 1,373, compared to Rs. 2,001 for the same population segment in urban areas.
- The top 5% of both rural and urban populations had significantly higher MPCE, indicating income disparities.
- State-wise and UT-wise Variations in MPCE:
- Sikkim reported the highest MPCE in both rural (₹7,731) and urban (₹12,105) areas, while Chhattisgarh had the lowest.
- Meghalaya exhibited the highest rural-urban MPCE difference among states, followed by Chhattisgarh.
- Food Spending Trends:
- The share of expenditure on food has gradually declined since 1999-2000, accompanied by an increase in spending on non-food items.
- Cereals and pulses’ share within food expenditure decreased, while spending on fruits, beverages, and processed foods increased.
- Changes in Methodology:
- The HCES 2022-23 underwent changes in item coverage, questionnaire, and data collection methods to enhance accuracy and efficiency.
Issues Related to Poverty Estimation:
- Changes in Consumption Patterns:
Different poverty estimation methodologies yield varying results, highlighting the need for a comprehensive analysis of changing consumption patterns and their implications for poverty estimates.
- Discrepancy Between NSSO and NAS Estimates:
Significant disparities between NSSO and NAS estimates of consumption expenditure raise concerns and require further investigation to reconcile differences.
- Implications for CPI and Inflation:
Changes in consumption patterns affect the calculation of CPI weights and inflation rates, necessitating adjustments to accurately reflect consumer behaviour.
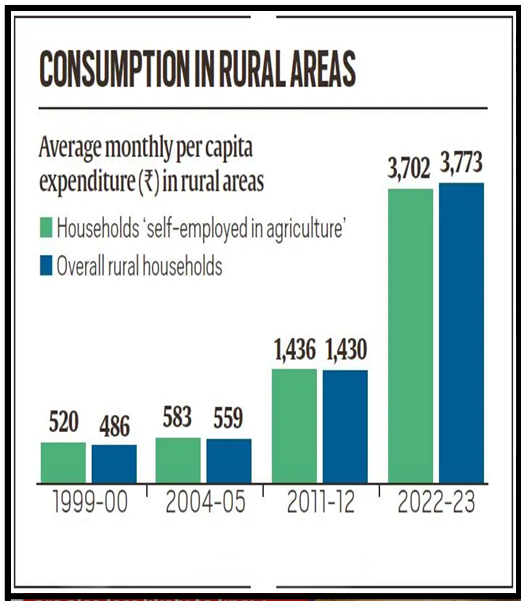
About Trends in Consumption Expenditure: Rural vs. Urban
- Rural Trends: Rural India has witnessed a decline in food expenditure from 1999-2000 to 2022-23, indicating changes in consumption patterns.
- Urban Trends: Urban areas show a similar trend with a decline in food expenditure, accompanied by a shift towards processed foods.
Education and Health Expenditure: Rural vs. Urban Disparities
- Education: Rural areas experienced an increase in education expenditure until 2009-10, followed by a decline. Urban areas show divergent trends.
- Healthcare: Non-hospitalization medical expenses have increased in both rural and urban areas, while hospitalisation expenses remain stable.
Normal Goods and Durable Goods: Indicators of Prosperity
- Normal Goods: Income growth has led to increased demand for durable goods in both rural and urban areas.
- Durable Goods: The rise in the share of durable goods reflects improving prosperity levels, indicating economic growth.
- Durable Goods Consumption:
- Increased shares of durable goods signify rising prosperity and income levels in both rural and urban areas.
- The convergence of rural and urban consumption patterns underscores the blurring of socio-economic differences.
About Shifts in Monthly Per Capita Consumption Expenditure (MPCE)
- Income and Consumption Growth: Overall, there has been growth in income and consumption expenditure, despite underestimation in household surveys.
- Rural Consumption: Rural households allocate less expenditure towards food, with a corresponding increase in non-food spending.
Per Capita Consumption Spending Trends in India:
Analysis of per capita monthly consumption expenditure highlights significant growth trends from 2011-12 to 2022-23.
- Increase in Consumption Expenditure:
- In 2022-23, India witnessed a substantial increase of 33-40% in per capita monthly consumption expenditure compared to 2011-12.
- This growth is indicative of improved economic conditions and rising incomes across the country.
- Annual Growth Rate:
- Rural areas experienced an average annual growth rate of1% in per capita monthly consumption expenditure.
- Urban areas recorded a slightly lower growth rate of7% during the same period.
- Per Capita Expenditure Figures:
- The estimated Monthly Per Capita Consumption Expenditure (MPCE) for rural India was Rs 3,773 in 2022-23.
- In contrast, urban India exhibited a higher MPCE of Rs 6,459 for the same period.
- Implications:
- The increase in per capita consumption expenditure signifies improved living standards and purchasing power among Indian households.
- Higher spending levels suggest greater economic activity and consumer confidence, contributing to overall economic growth.
About Changes in Food Consumption Patterns:
- Cereals and Pulses Decline: Traditional food items like cereals and pulses witness a decline in consumption, replaced by fruits, eggs, fish, meat, and processed foods.
- Rise of Processed Foods: The prevalence of processed foods suggests a shift in dietary preferences, possibly towards convenience and taste.
Challenges in Data Interpretation and Validation
- Methodological Changes: Changes in survey methodologies necessitate careful validation of data to ensure accuracy.
- Poverty and Inequality: While poverty ratios and inequality issues persist, the focus remains on analysing consumption expenditure shifts.
Way Forward:
- Continued monitoring of per capita consumption expenditure trends is essential to gauge the effectiveness of economic policies and programs.
- Further analysis may reveal insights into evolving consumer preferences, market dynamics, and socio-economic shifts.
- Ensure proper representation of households from diverse economic backgrounds in sampling to reflect ground realities accurately.
- Consider labour market outcomes alongside consumption data to provide a holistic understanding of economic conditions.
Conclusion
Understanding shifts in consumption patterns provides insights into economic development and societal changes.Further analysis and validation of data are essential to grasp the complexities of consumption behaviour and its implications for policy-making.
Source:
https://www.financialexpress.com/opinion/the-sheet-anchor-of-the-fact-sheet/3424537/
Mains Practice Question:
Discuss the significance of understanding consumption trends in India, and analyze the implications of shifts in consumption patterns for economic policies and societal changes.