
THE GROWTH, BASED ON GDP, GVA
Syllabus:
GS 2:
- Indian Economy and issues relating to planning, mobilization, of resources, growth, development and employment.
Focus:
- The difference between the two sets of growth rates widened to 190 basis points Q3.
 Source:- IE
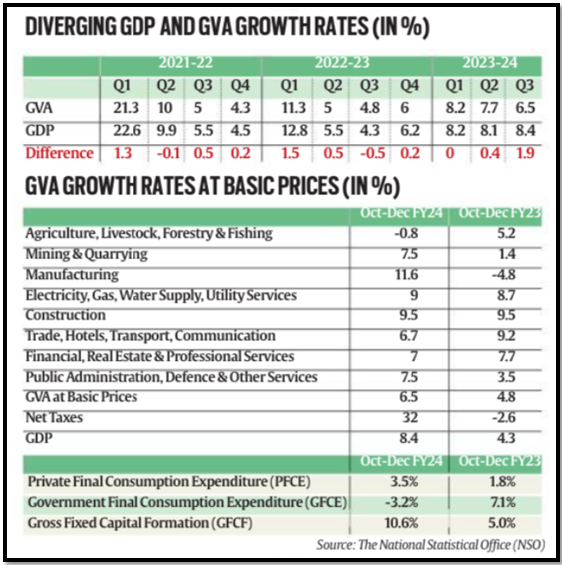
GDP Growth Highlights
- Exceptional Growth Rate: India’s GDP soared to an 8.4% increase in Q3 of 2023-24, outstripping RBI’s prediction of 6.5%.
- Annual Growth Estimate Uplifted: Revised full-year GDP growth estimate to 7.6%, an improvement from an earlier forecast of 7.3%.
- Sectoral Growth: Notable advancements in manufacturing, mining, construction, and various service sectors.
- Agricultural Sector Setback: Contrary to other sectors, agriculture saw a decrease, contracting by 0.8% in Q3.
- Exceeding Economists’ Expectations: The Q3 growth rate surpassed both RBI and economists’ projections, indicating a robust economic performance.
- Influence of Sectoral Performance: The significant growth in key sectors played a crucial role in propelling the overall GDP growth.
| GDP (Gross Domestic Product):
Definition: Measures the monetary value of all final goods and services produced within a country during a specific period. Components: · Private Final Consumption Expenditure (PFCE): Money spent by individuals on consumption. · Government Final Consumption Expenditure (GFCE): Money spent by the government on its current consumption, like salaries. · Gross Fixed Capital Expenditure: Investment towards boosting the economy’s productive capacity, including business investments and government infrastructure projects. · Net Exports (NX): The net effect of exports and imports. · Calculation: GDP = PFCE + Gross Investment + Government Investment + Government Spending + (Exports – Imports). GVA (Gross Value Added): · Definition: Calculates national income from the supply side by adding up the value added across different sectors. · Calculation: GVA = Value of Output – Value of Intermediary Inputs. GDP is derived from GVA data. · Equation: GDP = GVA + Taxes earned by the government – Subsidies provided by the government. · If taxes exceed subsidies, GDP is higher than GVA. · GDP data is useful for analyzing annual economic growth and comparing growth over time or with other countries. |
Disparity Between GDP and GVA
- Significant Divergence: The gap between GDP and GVA widened notably to 190 basis points in Q3, marking a decade high.
- Attribution to Fiscal Adjustments: The divergence largely stemmed from an increase in net taxes and a reduction in subsidies.
- GVA Growth Lag: While GDP grew at 8.4%, GVA’s growth was substantially lower at 6.5%.
- Concerns Over GDP Accuracy: The notable gap between GDP and GVA has led to suspicions that GDP figures may be overstated.
- Impact of Net Taxes and Subsidies: Adjustments in net taxes and subsidies are key factors contributing to the disparity between GDP and GVA rates.
- Economists’ Skepticism: The considerable difference between the two metrics has raised eyebrows among economic analysts.
Sectoral Contributions and Economic Activities
- Manufacturing Sector Boom: Achieved an impressive 11.6% growth, bouncing back from a previous downturn.
- Construction Sector Resilience: Demonstrated a strong 9.5% growth, indicating robust sectoral health.
- Agriculture’s Decline: Marked a downturn with a 0.8% contraction, diverging from other sectors’ growth.
- Services Sector Prosperity: Trade, hotels, transport, communication, and broadcasting services sectors experienced healthy growth.
- Sequential Decline in Manufacturing: Despite an annual boost, manufacturing saw a sequential decline in Q3.
- Financial and Real Estate Services Growth: These sectors also reported positive growth, contributing to the overall economic expansion.
Investment and Consumption Dynamics
- Investment Growth: Marked increase in investments, notably in the real estate sector, bolstering GDP growth.
- Consumption Expenditure Slowdown: Private final consumption showed a deceleration, reflecting subdued demand.
- Gross Fixed Capital Formation: This investment indicator grew by 10.6% in Q3, showcasing a healthy investment climate.
- Real Estate and Capex Cycle Revival: Investments in real estate and an uptick in industry utilization have rejuvenated the capital expenditure cycle.
- Subdued Private Consumption: Indicative of a broader slowdown in consumption demand, with private consumption expenditure growing at a modest rate.
- Government Expenditure Trends: A slight decrease in government final consumption expenditure, contrasting with the investment growth.
Revisions and Economic Adjustments
- Base Effect Revision: Q3’s growth rate benefited from a downward revision of the previous year’s figures.
- Upward Revision of Current Fiscal Estimates: The first two quarters of the fiscal year saw revised growth rates, indicating a stronger economic performance than initially estimated.
- Impact of Past Year Revisions: Adjustments to previous financial years’ growth rates have influenced the current fiscal year’s growth assessments.
- Quarterly Growth Rate Adjustments: Specific quarters experienced revisions, affecting the overall growth narrative for the fiscal year.
- Reassessment of Economic Performance: These revisions reflect updated evaluations of the economic health and trajectory.
- Significance of Revisions: The adjustments highlight the dynamic nature of economic analysis and the importance of accurate data for policy and planning.
Future Economic Outlook and Concerns
- Broad-Based Improvement Focus: Critical emphasis on enhancing consumption growth and private investments for sustained growth.
- Moderation Concerns: Potential for growth moderation due to slowing profit increases and rising input costs.
- Rural and Urban Demand Dynamics: The balance between strong rural demand and potentially moderating urban demand is pivotal.
- Government Expenditure Influence: Capital expenditure by the government remains a key driver for the capex cycle and economic momentum.
- Consumption Growth Subdued: Despite investment-driven GDP growth, private consumption remains weak, indicating areas for policy intervention.
- Economic Momentum and Profit Growth: As companies face slower profit growth, the overall economic momentum may face challenges.
Source:
https://indianexpress.com/todays-paper/
Mains Practice Question:
“Examine the factors contributing to the divergence between GDP and GVA growth rates in India’s recent economic data. Discuss the implications of such a divergence for economic policy and planning. Analyze how sectoral performances, particularly in manufacturing and agriculture, influence the overall economic growth narrative.