
Analyzing where India stands in the G20
Relevance:
- GS Paper 2 Important International institutions, agencies and fora- their structure, mandate
- Tags: #G20#India’sranking#Performance#SocialSector#ClimateSector#WBOpen Data#GDPData#HumanDevelopmentIndex#labourforceparticipationrate.
Why in the news?
India hosted the 18th G20 Summit in New Delhi, focusing on the theme ‘One Earth, One Family, One Future.’ Food security, climate change, energy, development, healthcare, and digitalization were deliberated upon at the global forum, formed to discuss economic and financial matters.
This analysis evaluates India’s performance in recent decades across various socioeconomic metrics in comparison to its fellow G20 members.
Member countries:The G20 is made up of India, Australia, China, Indonesia, Japan, South Korea, France, Germany, Italy, Russia, Turkey, the United Kingdom, the European Union (EU), Argentina, Brazil, Mexico, Canada, the United States, South Africa, and Saudi Arabia.
The country’s performance in recent decades across selected socioeconomic metrics has been poor compared to its fellow G20 members.
Analysis
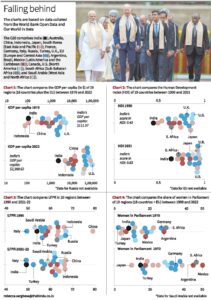
Chart 1
- Compares the GDP per capita (in $) of 19 regions (18 countries plus the EU) between 1970 and 2022. GDP per capita ($) is the sum of gross value added by all resident producers in the economy divided by mid-year population.
- In 1970, with a GDP per capita of $111.97, India ranked 18 out of the 19 regions analyzed. While Indonesia lagged behind India in 1970, it moved ahead by 2022, pushing India to the last spot with a GDP per capita of $2,388.62.
Chart 2
- Compares the Human Development Index (HDI) of 19 countries between 1990 and 2021.
- The HDI is a measure of life expectancy, access to education, and standard of living. HDI in the graph is measured on a scale of 0 (worst) to 1 (best).
- India’s HDI improved from 0.43 in 1990 to 0.63 in 2021. However, despite its progress in absolute terms, India ranked at the bottom of the list.
- India’s performance has seen little relative improvement in metrics relating to health, even though there has been growth in absolute numbers.
- In 1990, the average life expectancy in India was 45.22 years, which was better than China’s 33.27 years.
- By 2021, life expectancy rose to 67.24 years, ahead of South Africa. However, India’s ranking remained the same, as China surpassed India.
- In 1990, with an infant mortality rate of 88.8, India ranked at the bottom of the 20 regions analyzed.
- In 2021, the infant mortality rate improved to 25.5 and India ranked 19, just ahead of South Africa (26.4).
Chart 3
- Compares the labor force participation rate (LFPR) above 15 years of age in the 20 regions between 1990 and 2021-22.
- In 1990, with an LFPR of 54.2%, India ranked 18, above Italy (49.7%) and Saudi Arabia (53.3%).
- In 2021-22, its rank slipped to 19, only ahead of Italy’s (49.4%). Notably, India’s LFPR also decreased to 49.5% in this period.
Chart 4
- Compares the share of women in Parliament of 19 regions (18 countries plus the EU) between 1998 and 2022.
- Despite having seen several women in leadership positions, India’s relative growth in the share of women in Parliament has been slow, with many countries and the EU outpacing India.
- From 8.1% in 1998, the share almost doubled to 14.9% in 2022. But when compared to the 18 countries and the EU, India’s rank slipped from 15 in 1998 to 18 in 2022, just ahead of Japan (9.9%).
Conclusion
India has succeeded in curbing carbon emissions over the past three decades.It has been the lowest emitter of CO2 in 1990 and 2020 among the 20 regions analyzed.However, its progress in adopting eco-friendly energy sources to combat climate change has been relatively slow.
Source: The Hindu