
Real Growth vs. Fake Arguments.
Relevance
- GS Paper 3 Indian Economy and issues relating to Planning, Mobilization of Resources.
- Tags: #GDPGrowth #RBIForecast #GS3 #MintEditorial #UPSC #EditorialAnalysis.
Why in the News?
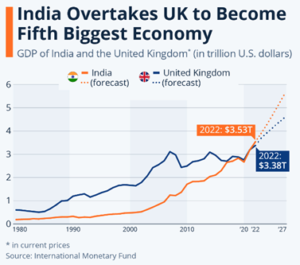
India’s recent GDP growth of 7.8% in the fiscal first quarter of 2023 has sparked debates regarding data credibility, the reliability of growth figures and the underlying economic factors.
Mixed Responses to India’s Strong Q1 GDP Growth
- Many forecasts have raised their economic growth estimates for 2023-24 as a result of India’s impressive 7.8% fiscal Q1 GDP growth.
- Despite the facts, some opponents, such as Project Syndicate’s ‘India’s Fake progress Story,’ continue their doubt, disputing the narrative of steady progress.
- The heart of the essay appears to be this line entry titled ‘Statistical discrepancy.’
Data Systems in India: Income Estimation vs. Expenditure Analysis
- The architecture of data systems in India makes it simpler to estimate national revenue from the income side rather than the spending side.
- It is simpler to calculate an organization’s revenue or gross value added (GVA) by subtracting its output from its inputs than it is to examine output-wise spending in the overall economy, segregating costs on final and intermediate products and services.
- When more robust income-side estimates are created, the expenditure-side method is typically made easier. It is also beneficial for analyzing different demand components.
Understanding Variations in India’s Q1 2023-24 Economic Data
Positive Discrepancy in Q1 2023-24
- In the first quarter of 2023-24, there’s a positive 2.8% variation, meaning that the expenditure side has only accounted for 97.2% of the income side.
- This unexplained 2.8% doesn’t mean it doesn’t exist; it will be addressed in future quarters.
Negative Discrepancies in the Past
- In simple terms, over the past eight quarters, when experts looked at how people in the country were spending their money, they found that they were overestimating it.
- It means they thought people were spending more than they actually were.
- This negative variation shows that the spending side of the economy needed to be adjusted to better match the real numbers.
Long-Term Growth Trends
- Looking at the long-term trend, the Compound Annual Growth Rate (CAGR) of real GDP (quarter-to-quarter) averaged 5.3% between the income and spending methods from Quarter 1 of FY12 to Quarter 1 of FY24.
- This demonstrates the significance of recognizing and resolving disparities in order to appropriately estimate overall economic performance.
- The idea that GDP numbers are inflated (made to seem bigger than they really are) doesn’t make sense.
- This is because sometimes the way we measure GDP from the income side is higher, and sometimes it’s lower than when we measure it from the expenditure side.
- This has been happening since 2011-12, with the difference ranging from 6.4% more on the income side to 4.8% less.
- The recent difference is well within this range, so it’s nothing unusual. You can easily check this by looking at the data.
Understanding GDP Figures and Credibility
- In simple terms, when the government announced that the economy shrank by about 25% in the first quarter of 2020-21, nobody questioned the accuracy of the data because it was a severe and well-documented economic contraction.
- Now, when the government reports strong economic growth in the first quarter of 2023-24, some people accuse them of exaggerating the numbers.
- However, it’s important to know that government statisticians have always calculated GDP growth based on the income approach, regardless of whether it’s higher or lower than the expenditure-based estimate.
- So, there’s no bias in how they report growth; it’s consistent with their methods.
Economic Growth and Projections: A Simple Explanation
- Experts’ Predictions: Many experts and economists estimated that the economy would grow between 7.8% and 8.3% in a specific quarter. Even the Reserve Bank of India (RBI) expected an 8% growth rate for that period.
- Positive Signs: Various signs, like GST collections, e-way bills, and business surveys, indicated that the economy was indeed growing strongly. These indicators have been showing positive trends for some time.
- Private Sector Investments: Companies have started investing more money in their businesses after a period of decline. This is a good sign and shows that businesses are confident about the future.
- RBI’s Expectations: RBI also believes that the economy will grow by 6.5% for the entire year, and the Ministry of Finance agrees with this estimate, considering the risks to be balanced.
- Revised Figures: It’s likely that the growth rate for the previous year (2022-23) will be adjusted upward when the final numbers are released in 2026, indicating even better growth than initially reported.
Economic Recovery and Stability in India
- In the last decade, India faced issues with the financial and corporate sectors, which slowed down economic growth.
- However, things have improved. Banks are now lending money, companies are starting to invest, and credit growth is strong.
During the COVID-19 pandemic, India managed to stabilize the economy without excessive spending. Instead, they focused on targeted relief and investing in public projects. This approach has laid a stable foundation for future economic growth and better living standards in the years to come.
Source: Livemint.
Mains Question
Discuss the reasons behind the variation between GDP growth estimates based on the income approach and the expenditure approach, and how do they impact economic analysis?